EPHIN Trends Post-Failure-mode-A On
EPHIN E150 Coincidence Rate
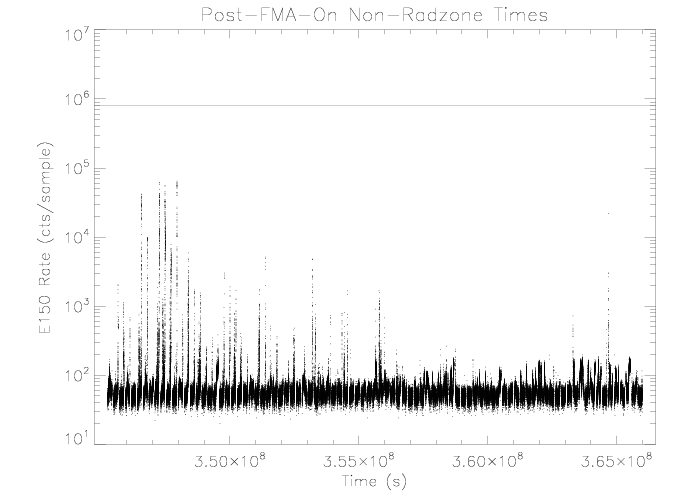
The E150 rate shows an increase on approaching the Earth's radiation
zone, likely due to electrons. Additionally there is a gradual
upward trend in the rate as the sensor temperature increases. The
rate increase with temperature is due to a decrease in
detector C sensitivity (see Figure 8), resulting in a mis-assignment of higher
energy particles into this coincidence channel.
|
| Figure 1: EPHIN E150 coincidence channel rate vs time
for the time outside the radiation zone of the
orbits following the reconfiguration of EPHIN with
failure-mode detector A on and the detector B ring
segments disabled. The horizontal red line is the RADMON
trigger threshold, 800000 cts/sample.
|
|
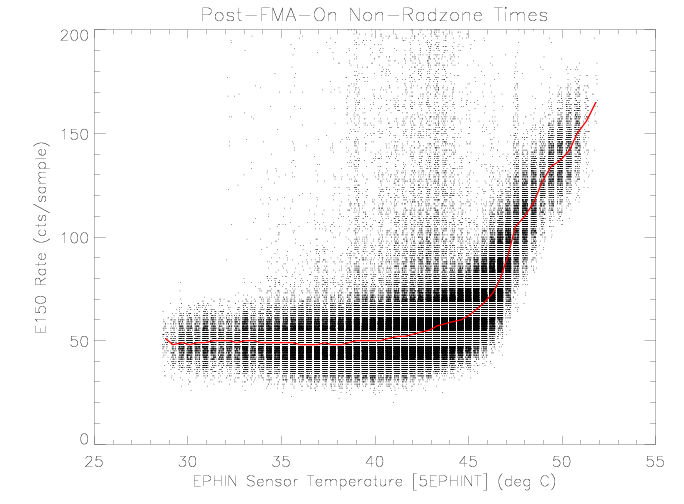
| Figure 2: EPHIN E150 coincidence channel rate vs EPHIN
sensor temperature for times as selected in
figure 1. The sensor temperature values have a
small, uniformly-distributed random valued added for
display purposes. The red curve is the median rate as a
function of temperature.
|
"E1300" Rate
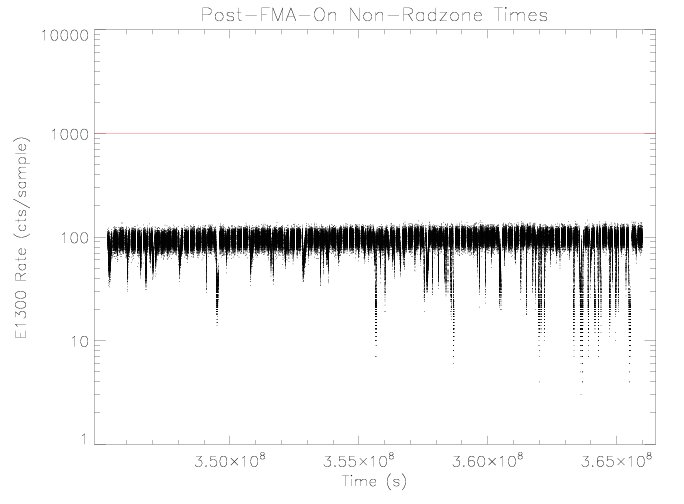
The E1300 rates show drops associated with higher EPHIN sensor
temperatures. The decrease in rate with higher temperature is due
to a decrease in detector C sensitivity as the temperture
increases (see Figure 8).
|
| Figure 3: EPHIN E1300 coincidence channel rate vs time
for times as selected in figure 1. The horizontal red
line is the RADMON trigger threshold 1000 cts/sample
|
|
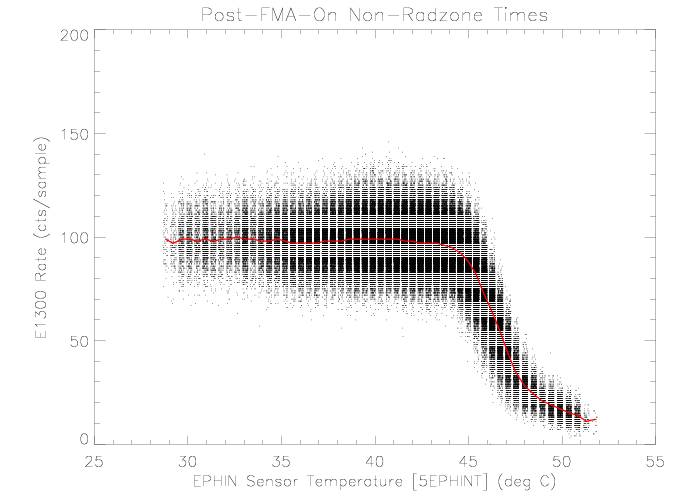
| Figure 4: EPHIN E1300 coincidence channel rate vs EPHIN sensor
temperature for times as selected in figure 1. The red
curve is the median rate as a function of temperature.
|
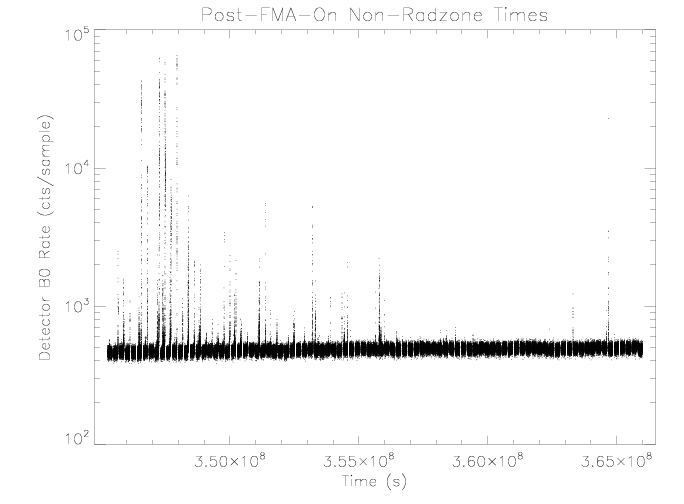
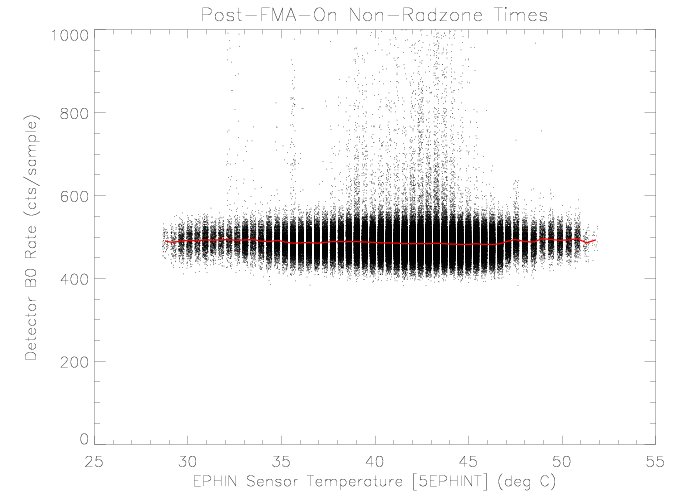
Detector B0 (Center Segment)
The detector B0 rate increases as the Earth's radiation zone is
approached, similar to the increases in the E150 rate. The rate
does not appear to be affected by sensor temperature over the
observed range.
|
| Figure 5: EPHIN detector B0 rate vs time for times as
selected in figure 1.
|
|
| Figure 6: EPHIN detector B0 rate vs EPHIN sensor
temperature for times as selected in figure 1.
|
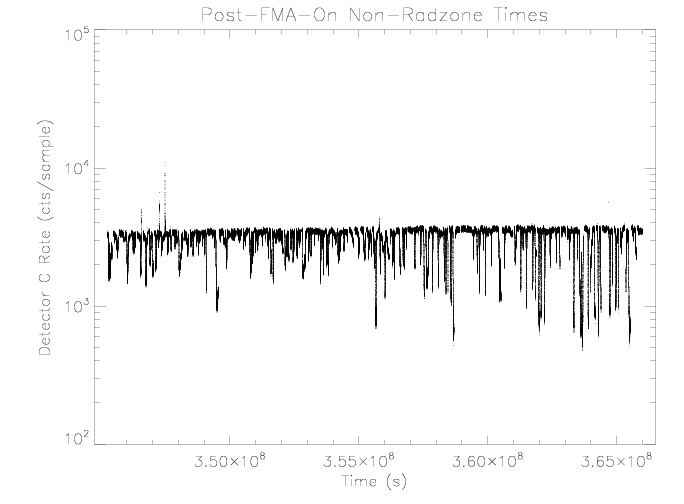
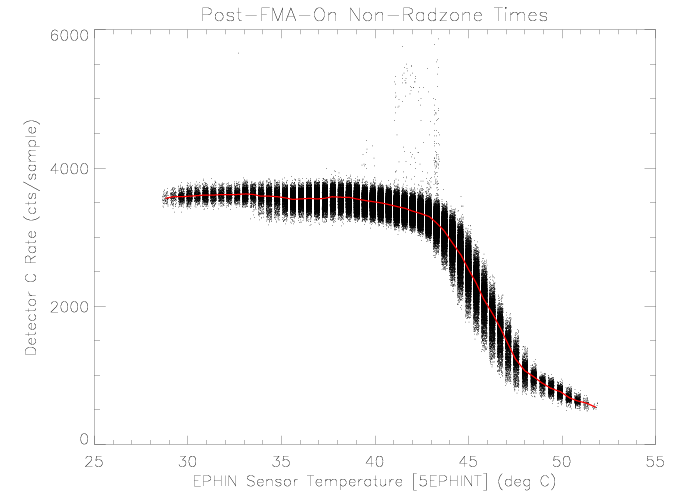
Detector C
The detector C rate decreases with increasing sensor temperature above
roughly 43 degrees C. This behavior is the same as observed prior
to setting detector A failure-mode on. The decrease in rate
implies a decreased sensitivity to particles, possibly due to a
lower voltage across the detector.
|
| Figure 7: EPHIN detector C rate vs time for times as
selected in figure 1.
|
|
| Figure 8: EPHIN detector C rate vs EPHIN sensor
temperature for times as selected in figure 1.
|
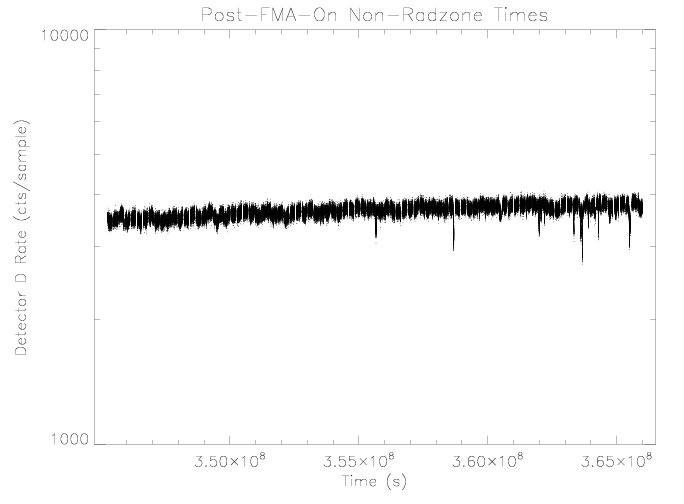
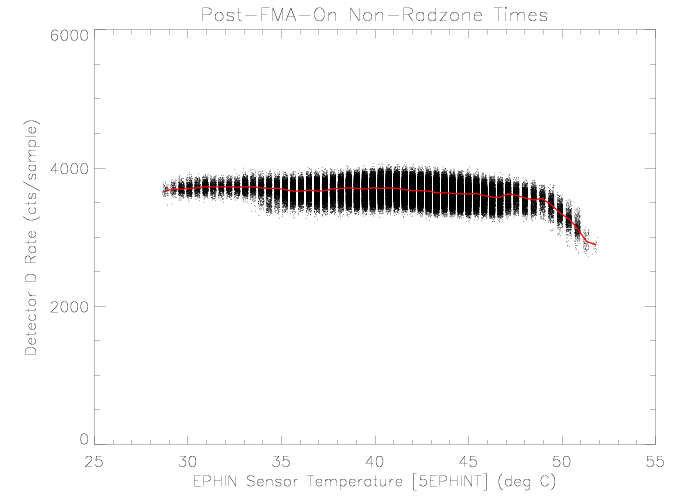
Detector D
As seen in the past, the detector D rate does not appear to be
affected by sensor temperature over the observed range. Over the
period examined the temperature has not been as high as during the
Normal-Sun-Mode episodes and did not reach the temperature where
the rate has been observed to drop.
|
| Figure 9: EPHIN detector D rate vs time for times as
selected in figure 1.
|
|
| Figure 10: EPHIN detector D rate vs EPHIN sensor
temperature for times as selected in figure 1.
|
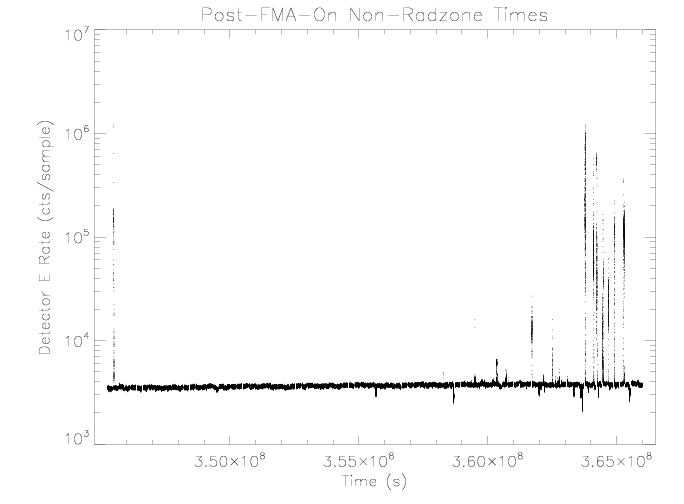
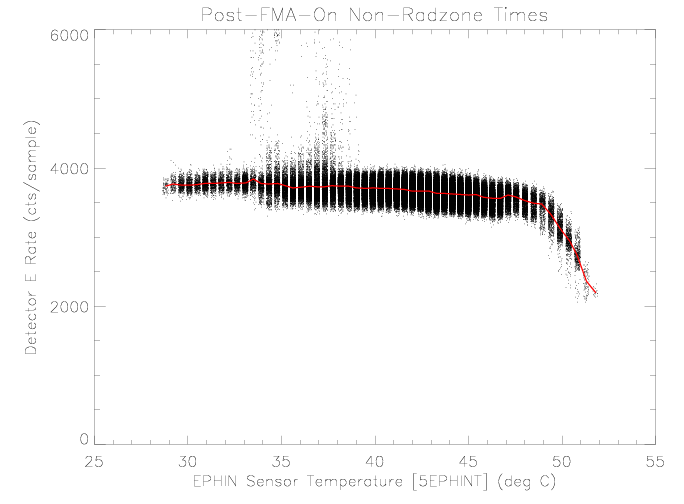
Detector E
Similar to detector D, the detector E rate does not appear to be
affected by sensor temperature over the observed range. There was
a brief episode of noisy behavior in the rate near the start of
the second orbit similar to noise observed in the past. This noise
is similar to that observed in the same detector on the SOHO EPHIN
and has been attributed by the EPHIN IPI team to mounting stresses.
|
| Figure 11: EPHIN detector E rate vs time for times as
selected in figure 1.
|
|
| Figure 12: EPHIN detector E rate vs EPHIN sensor
temperature for times as selected in figure 1.
|
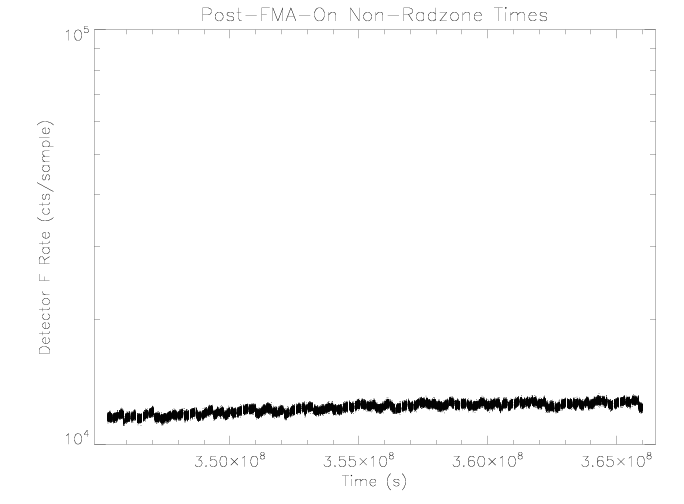
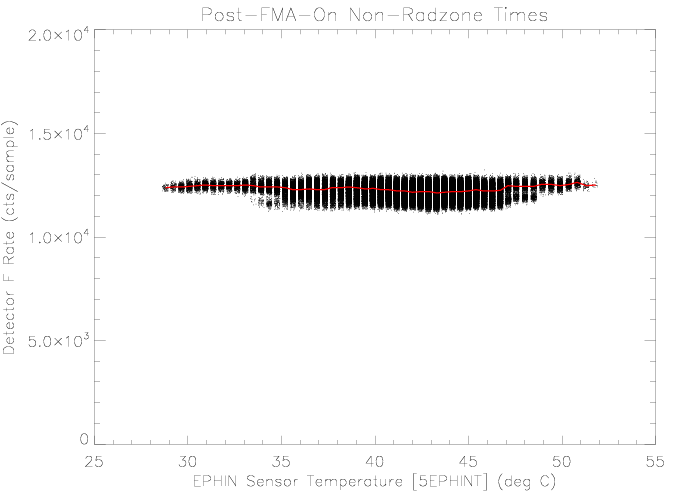
Detector F
Similar to detector D, the detector F rate does not appear to be
affected by sensor temperature over the observed range.
|
| Figure 13: EPHIN detector F rate vs time for times as
selected in figure 1.
|
|
| Figure 14: EPHIN detector F rate vs EPHIN sensor
temperature for times as selected in figure 1.
|
Last modified: Thu Aug 20 10:51:09 EDT 2009
Dr. Michael Juda
Harvard-Smithsonian Center for Astrophysics
60 Garden Street, Mail Stop 70
Cambridge, MA 02138, USA
Ph.: (617) 495-7062
Fax: (617) 495-7356
E-mail:
mjuda@cfa.harvard.edu