EPHIN Rates v Sensor Temperature (5EPHINT)
As we continue to relax the Mission Planning Guideline that covers the
EPHIN Thermal Limit, we need to trend the EPHIN performance to
monitor for unexpected changes in performance. The plots here show
the trends observed during the period from 2011-03-06 to
2011-07-16. During this interval the TEPHIN planning limits was
132 degF (last raised in 2010 December). The interval contains the
2011 July safemode event for which the EPHIN temperature reached a
new mission maximum.
EPHIN data were selected for times outside the
rad-zone; that is selecting samples after the latest XEF1000 orbital event
after perigee and before the earliest EEF100 orbital event before
the next perigee. Data from solar events have not been
excluded.
There is new behavior observed in detectors B0 and C for temperatures
above ~55.5 degC. The behavior in the B0 detector has an effect on
the E150 rate.
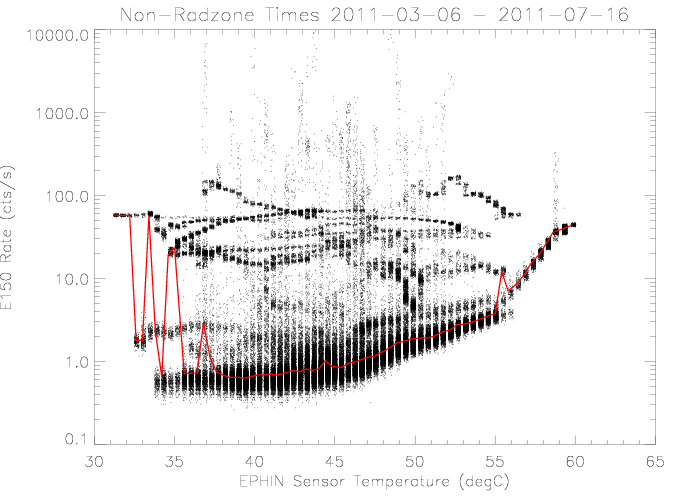
EPHIN E150 Coincidence Rate
The E150 rate shows some increases over a baseline value at all
temperatures. Most of these are an increase on approaching the
Earth's radiation zone, likely due to electrons. There is also a
slight increase associated with increased solar proton flux on
August 3. Additionally there is a gradual upward trend in the
baseline rate as the sensor temperature increases. The rate
increase with temperature is due to a decrease in detector C
sensitivity, resulting in a mis-assignment of higher energy
particles into this coincidence channel. There is a secondary
increase in the rate for temperatures above ~55.5 degC associated
with an increase in the detector B0 rate.
|
| Figure 1: EPHIN E150 coincidence channel rate vs EPHIN
sensor temperature The sensor temperature values have a
small, uniformly-distributed random valued added for
display purposes. The red curve is the median rate as a
function of temperature.
|
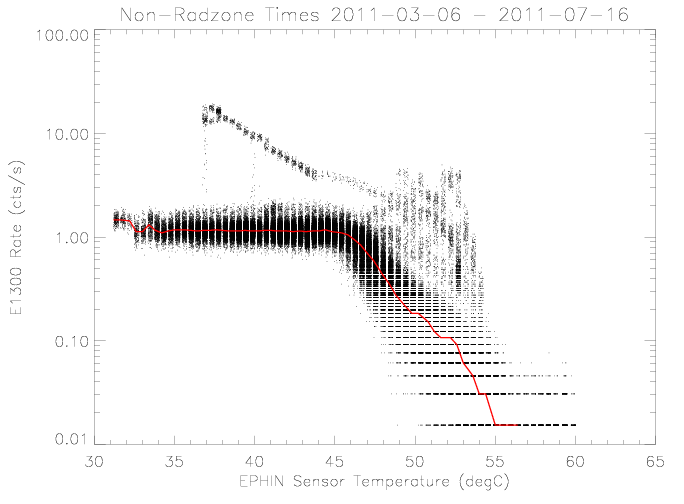
E1300 Rate
The E1300 rates show drops associated with higher EPHIN sensor
temperatures. The decrease in rate with higher temperature is due
to a decrease in detector C sensitivity as the temperature
increases. There is no rate increase in conjunction with the
detector C rate increase for temperatures above ~55.5 degC since
the signals are not in coincidence with those from other detectors.
|
| Figure 2: EPHIN E1300 coincidence channel rate vs EPHIN sensor
temperature, similar to figure 1.
|
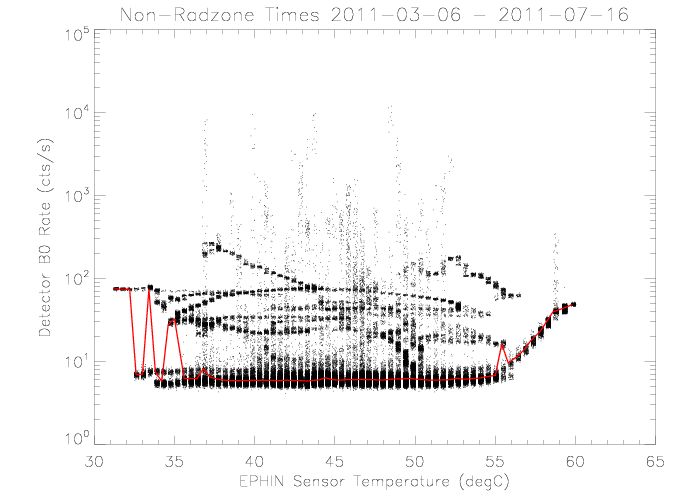
Detector B0 (Center Segment)
The detector B0 rate increases as the Earth's radiation zone is
approached, similar to the increases in the E150 rate as expected
given that the B0 signal is the dominant component of the E150
coincidence channel. There is an increase in the rate for
temperatures above ~55.5 degC; this increase is likely due to the
detector leakage current.
|
| Figure 3: EPHIN detector B0 rate vs EPHIN sensor
temperature, similar to figure 1.
|
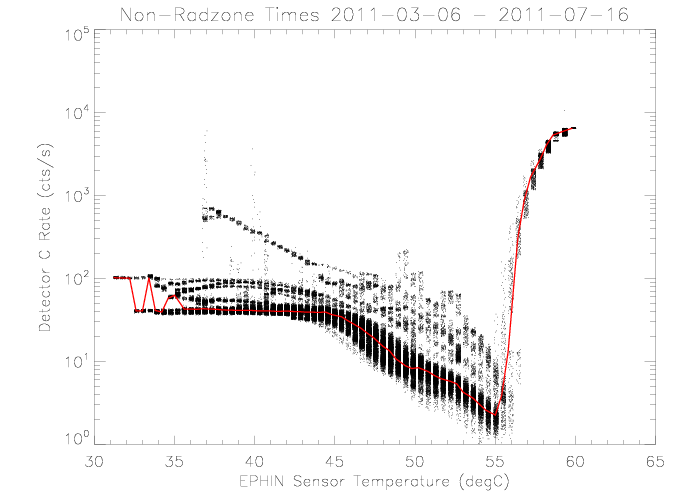
Detector C
The detector C rate decreases with increasing sensor temperature above
roughly 43 degrees C. This behavior is the same as observed prior
to setting detector A failure-mode on. The decrease in rate
implies a decreased sensitivity to particles and is due to a
lower voltage across the detector. The upturn in the rate above
55.5 degC (similar to detector B0) is likely due to leakage current.
|
| Figure 4: EPHIN detector C rate vs EPHIN sensor
temperature, similar to figure 1.
|
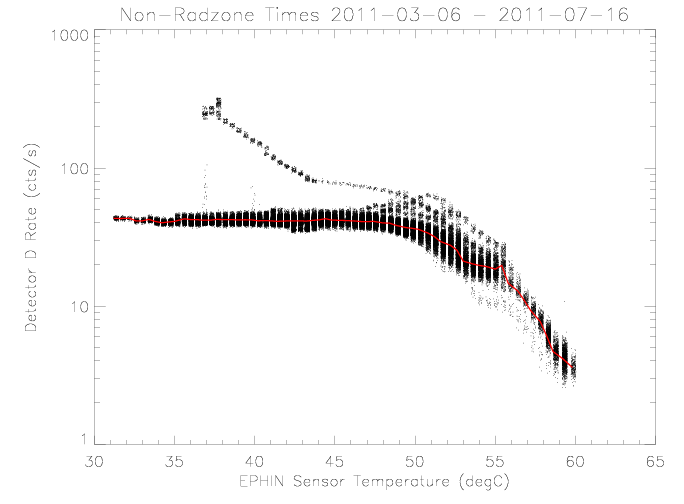
Detector D
The detector D rate decreases with increasing sensor temperature above
roughly 50 degrees C, somewhat higher than detector C. As with
detector C, the decrease in rates implies a decreased sensitivity
to particles. The higher temperature of the on-set of the decrease
is consistent with the different detector thickness
|
| Figure 4: EPHIN detector D rate vs EPHIN sensor
temperature, similar to figure 1.
|
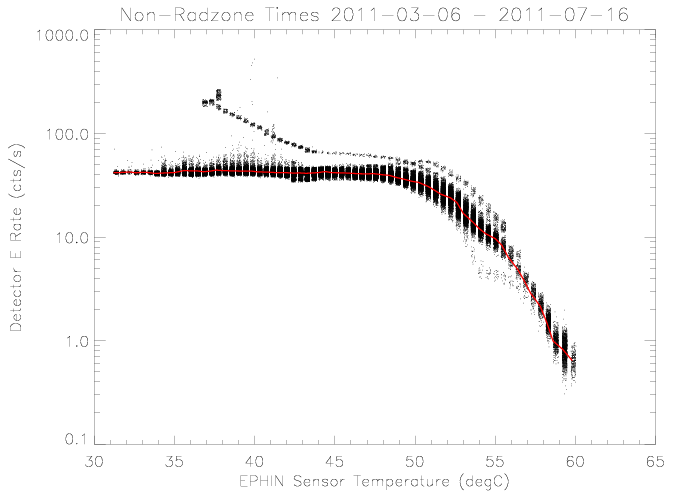
Detector E
The detector E rate decreases with increasing sensor temperature above
roughly 50 degrees C, similar to detector D. As with
detectors C and D, the decrease in rates implies a decreased sensitivity
to particles.
|
| Figure 4: EPHIN detector E rate vs EPHIN sensor
temperature, similar to figure 1.
|
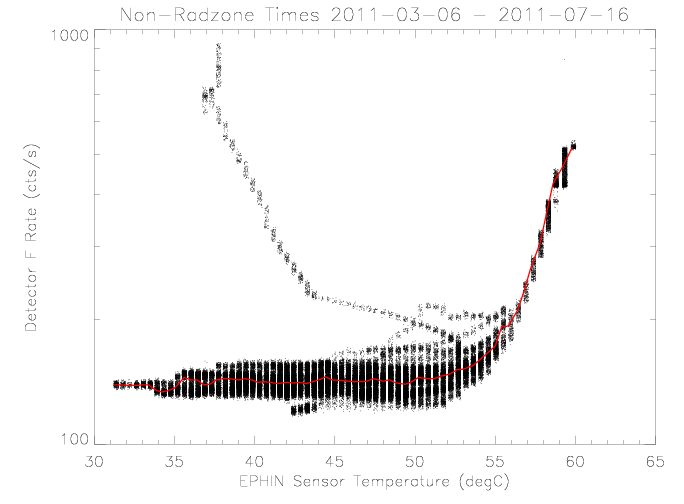
Detector F
The detector F rate shows an increase as the rate exceeds roughly 53
degrees C. This may be due to increasing noise that would be
reflected in a higher leakage current. Unfortunately, the ceiling on the
telemetry reading for the leakage current has been reached at 48
degrees C.
|
| Figure 4: EPHIN detector F rate vs EPHIN sensor
temperature, similar to figure 1.
|
Mike Juda
Last modified: Mon Jul 18 10:30:50 EDT 2011