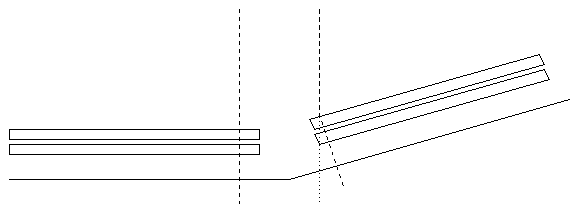

The bent solid line is a schematic representation of the CGCD axis; the position along this line is a monotonic/continuous linear readout. The MCP pair segments are shown above this. The dashed lines represent where an incoming x-ray is assigned a position by the CGCD. The dotted line shows the position where the x-ray should be assigned for the tilted segment.
An estimate of the size of the discontinuity can be calculated from the nominal outer segment tilts and distance from the front MCP surface to the CGCD. Assuming a nominal distance of 4.090 mm, estimates of the amount of shift going across the gaps are in the following table.
| Apparent shift | |||
|---|---|---|---|
| Segment | Tilt (degrees) | (microns) | (pixels) |
| 0 (+1) | 1.43 | 102 | 15.8 |
| 2 (-1) | 1.22 | 88 | 13.6 |
The sizes in this table close to the sizes that Steve Murray has observed:
"... Most important is that there is a well understood discontinuity in the HRC-S V-axis position (HRC coordinates) moving across the segments. This is very simply due to the tilt angle and finite thickness of the detector. The result is that there is about a 13 pixel increase in the reported V coordinate going from the +1 segment to the -0 segment, and another 16 pixel jump going from the -0 segment to the -1 segment. ..."The magnitude of the effect is such that it must be included by the ASCDS tools when performing coordinate transformations. This should simply be a matter of setting the parameters specifying the corners of the MCP segments to include the appropriate shifts. The size of the discontinuities can be determined using XRCF calibration data.
One complication to the analysis is that the observations were "dithered" in order to prevent damage to the HRC MCPs; the photons from the naturally narrow Mg-K line were spread over a 1 mm by 1 mm area. I have used the event lists generated by the ASCDS reprocessing runs of 1997 October for the following analysis. This reprocessing incorporated the following:
I fit gaussians to the 1-dim profiles of the orders of the Mg-K line in both event lists; for G-LHS-FC=1.001 only orders on the center MCP segment were fit, for G-LHS-FC-1.002 all, unblocked orders were fit. Note that the WCS should remove all the effects of translation of the FAM so we should not see the orders move by 1 mm (~156 pixels) in the WCS. The following tables list the order and mean WCS "X" position.
Links to tables
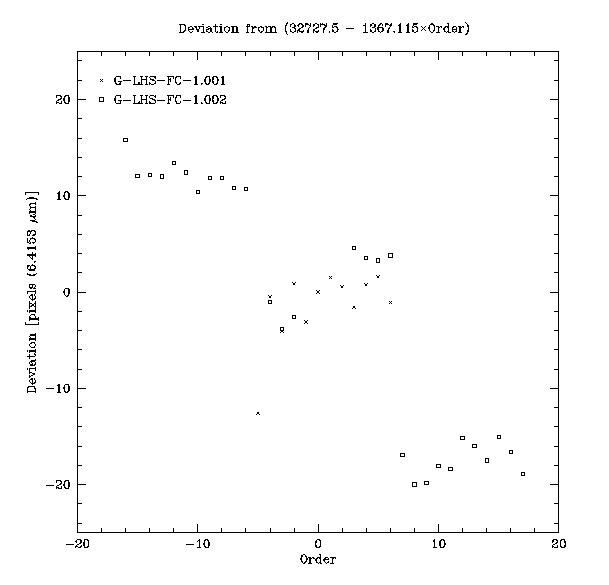
The expected locations of the orders can be determined from the wavelength of the Mg-K line (9.8903 Å), the LETG period (9910.2 Å), LETG to HRC spacing at the XRCF (8788.10 mm), the pixel size (6.4153 microns), and the nominal WCS X value for the aim-point (32727.5). In the figure below I have plotted the deviation (in WCS pixels) of the observed position from the expected one. The discontinuities in the coordinates are obvious. On the positive order side the discontinuity is about 17 pixels, on the negative side about 12.

The scatter of the deviations (~5 pixels) is fairly large given that the sigmas of the fit gausians were typically 10 pixels. Some of this scatter may be due to incorrect degapping parameters (i.e. not accounting for positional variation in the degap coefficients). It should be possible to test this by reprocessing the data using the recently supplied position dependent degapping coefficients.
Dr. Michael Juda
Harvard-Smithsonian Center for Astrophysics
60 Garden Street, Mail Stop 70
Cambridge, MA 02138, USA
Ph.: (617) 495-7062
Fax: (617) 495-7356
E-mail: mjuda@cfa.harvard.edu