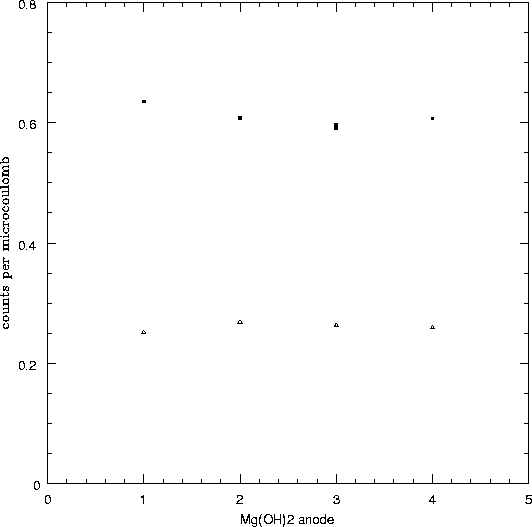
The solid boxes are the monitor detector data points. The open triangles are the
BND data points. The uncertainty in the data is approximated by the
size of the points. The y-axis is the net detector rate, normalized for anode
emission current (counts/µC). The x-axis is the coded date of the cross
calibration sets:
| 1: |
3-5 June 1997 |
| 2: |
6 June 1997 |
| 3: |
9 June 1997 |
| 4: |
12 June 1997 |
Note that the Mg(OH)2 anode was removed on June 4 and replaced on
June 5.
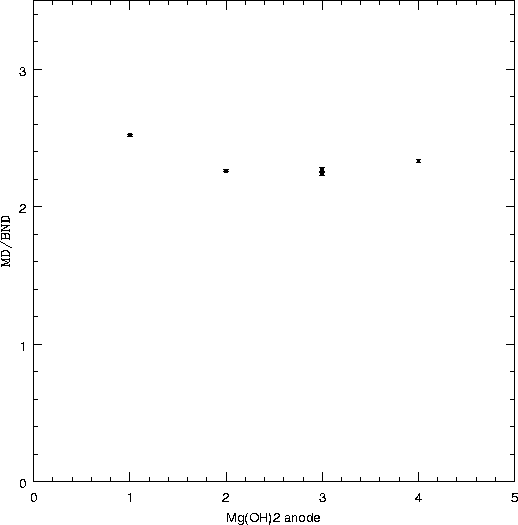
The graph on the right plots the ratios of the MD and BND data points,
with error bars representing the poisson uncertainty in the data.


