Flight settings Ag flat field map plots
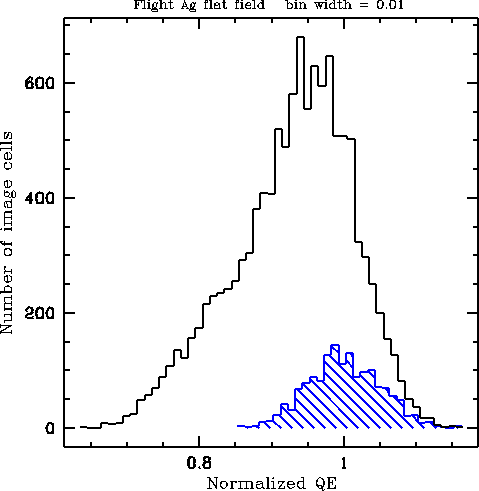
Histogram for the CsI coated area and the
central area of the map.
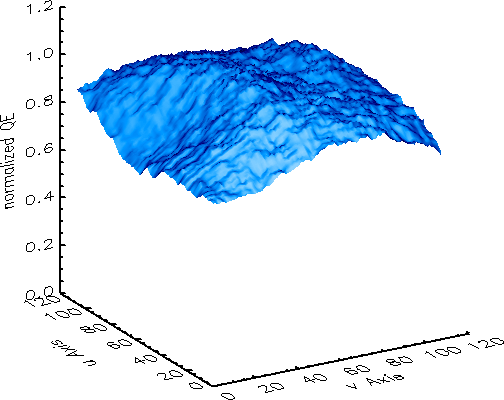

All three plots are of the CsI coated area
of the MCP.
The surface plot has been smoothed with a
5 × 5 boxcar. The data are normalized such that the mean
value in the central region of the MCP is unity.
Download:
FITS image [normalized data]