To compare the data in CC vs. TE mode, we plot the spectra of data integrated
over CHIPY. The CTI corrector uses the default value of CHIPY in the event
list, therefore for TE data, it uses the real value of CHIPY and for CC data
it essentially uses a random number between 1 and 512 for CHIPY as the value
recorded in the CHIPY column has nothing to do with the Y position of the
event in the chip.
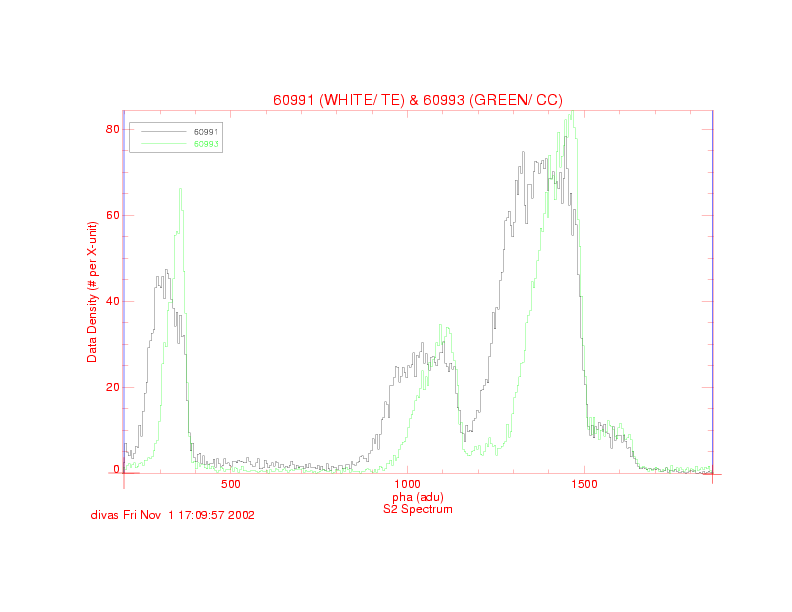
This figure shows the observed spectrum of the Ext Cal Source on S2 in TE mode
(black line : ObsID 60991) and CC mode (green line : ObsID 60993) in the PHA
space.
Notice:
- This is the spectrum integrated over the whole range of CHIPYs and
that's why it is ugly.
- The CC mode spectrum (green line) shows that it is LESS AFFECTED by CTI.
The CC peak is narrow and less extended towards lower energies. Which means
that the charge loss in CC mode is less. One reason could be that charge loss
due to short time constant traps would be minimized is CC data where the
charge transfer timescale is 2.85 millisecond vs. about 40 microsecond for the
transfer timescale for the TE mode data.
- In some senses, it implies that CC mode is more robust in terms of CTI
degradation that the TE mode.