 |
 |
 |
|
Image 2 of 13 |
Tables of the Gaussian fits to the four lines separately for each node. Lower half of the table in each page shows the results after removing 96 columns close to readout in each node due to potential (?) problems with BIAS (see the note by Peter Ford on the BIAS analysis of CC vs. TE data).
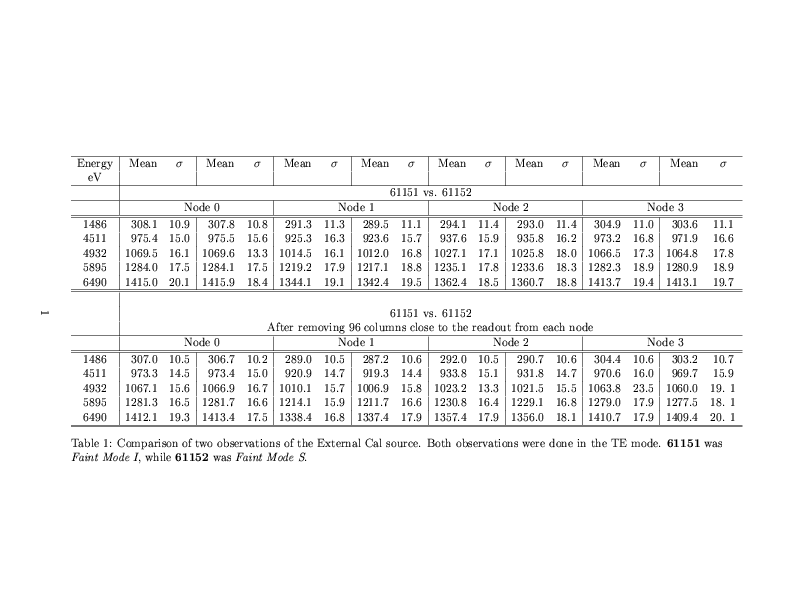
Table 1 : TE vs. TE. First Column is the line energy. Then for each node, I list the mean and sigma for the Gaussian fit for the two observations being compared.