

|

|


The angular dispersion relation depends, through the grating equation, on the grating period; the Rowland diameter then fixes the spatial dispersion relation. Until very recently, the CIAO and pipeline software could only accomodate one value of the Rowland circle for all gratings (this was based on the original grating specifications). After launch and some detailed analyses of empirical dispersion relations, it became apparent that the LETG and HETG Rowland diameters were not the same. It has taken some time to modify software to allow for this.
The dispersion relation also depends on knowledge of the spatial imaging characteristics of the detector, which is typically characterised by a pixel size. In the ACIS detector, the pixels have physical boundaries. In the HRC-S, pixels do not have firm boundaries, but the scale in the dispersion direction is determined essentially by the pitch of windings of the signal carring wires wound around a former (know colloquially as the "dog bone"). In principle, the pitch of these windings is known very accurately. Note that the accepted value of the ACIS pixel size has changed since launch, and so LETG+ACIS-S data processed with older software versions will have a different dispersion relation.
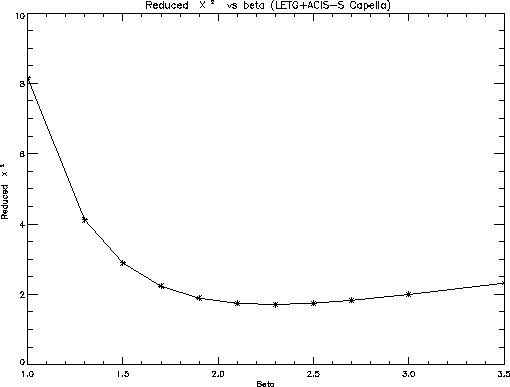
Results of the extensive dispersion relation analysis carried out by the LETG group in 200 are illustrated below.


Results of a new dispersion relation analysis of co-added LETG+HRC-S observations of Capella, shown for the central HRC-S plate. Note the distortions to the relation near -20 AA. It is possible there is a residual slope, even after allowance for detector non-linearities, though Capella's orbital motions need also to be considered. In this regard, it is not know exactly what fraction of the observed emission at any given temperature arises from each star. HST STIS observations of Fe XXI 1354 AA and FUSE observations of Fe XVIII 974 AA yield partially conflicting results, the former suggesting that the GO III component dominates at log T ~ 7.1 (Johnson et al, 2001, ApJL, in press), while the latter indicates that the G8 III dominates at log T ~ 6.8 (Young et al., 2001, ApJ, 555, L121). These observations were not simultaneous and it is probable that the relative contributions of the two stars are significantly variable.

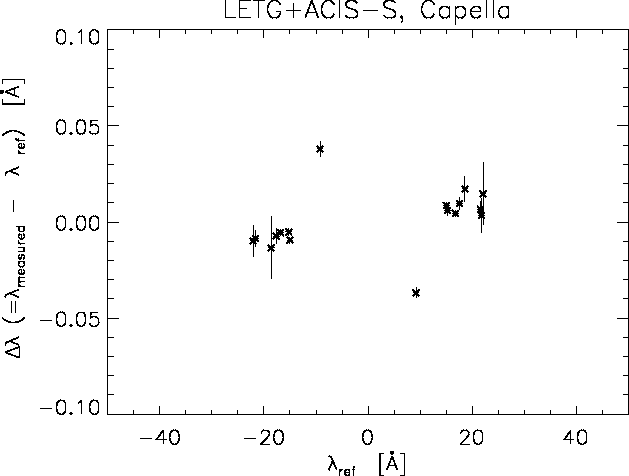
A new dispersion relation analysis of LETG+ACIS-S observations of Capella indicate a significant residual slope that implies a different dispersion relation for AICS-S and HRC-S detectors. At face value. this cannot be reconciled unless there are wignificant errors in existing pixel size values in either or both detectors. These results need to be verified.
Comments and questions to: Jeremy Drake
Last modified: 06/14/02
 |
The Chandra X-Ray
Center (CXC) is operated for NASA by the Smithsonian Astrophysical Observatory. 60 Garden Street, Cambridge, MA 02138 USA. Email: cxcweb@head.cfa.harvard.edu Smithsonian Institution, Copyright © 1998-2004. All rights reserved. |