

|
|
|
This is a brief summary of the analysis of XRCF calibration data
on the LETG, MEG, and HEG diffraction efficiencies described
elsewhere,
and presents the latest results in pretty plots.
P. Ratzlaff has done virtually all the actual data fitting, modeling,
and computer coding.
Those spectra were derived primarily from fits to HSI images of dispersed spectra (see Sn-L spectrum below), and also SSD spectra. They also take into account time-dependent QE degradation of the HSI at its nominal aimpoint.
Model spectra were then fed into MARX simulations to determine what fraction of each spectral line passed through the focal plane aperture, using HXDS translation stage logs to determine the true aperture position. Focus position errors in the x direction (along the optical axis) were also accounted for. This analysis was repeated assuming positioning errors of +/-100 microns in y and z to estimate the uncertainty in each line's relative intensity.
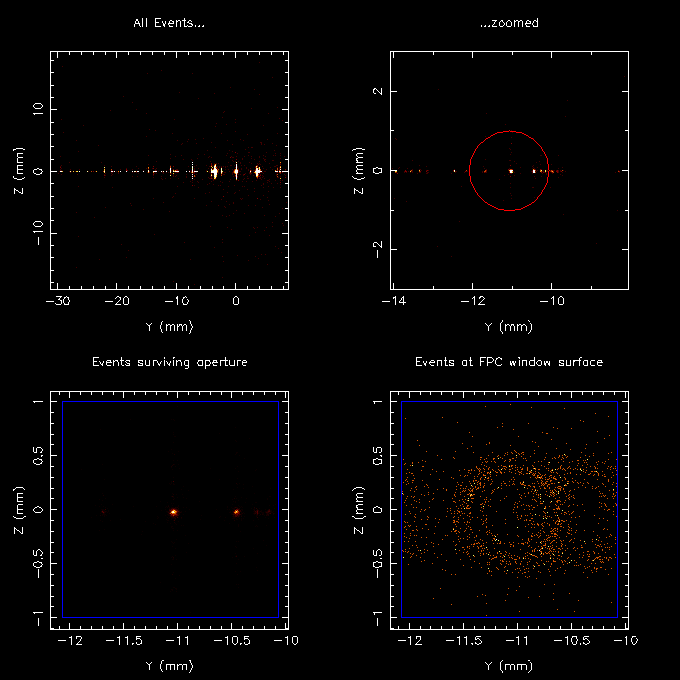
Upper left: MARX sim of dispersed spectrum, all orders.
Upper right: Closeup showing aperture in red.
Lower left: Further closeup showing rays that get through the aperture.
Lower right: Rays diverge after passing through aperture and impact upon the proportional counter window. Blue square outlines the location of the window support wires surrounding the central 2mm x 2mm windowlet. Some x-rays may hit the wires and not be detected. Others are incident upon angled portions of the window, thus passing through a longer pathlength of window material.
Results from model of proportional counter window bowing. Windowlet center deflects by more than 200 microns. Near the wires, the window surface is angled at nearly 30 degrees, leading to an increase in the effective window thickness, Teff, of roughly 15%.
For measurements of higher-order diffraction (conducted at 7 energies for 2nd order or higher, up to 31st), photons from several orders may pass through the focal plane aperture. In the plot below, cases where orders overlap are shown in colored boxes whose widths are equal to the aperture width. Ag-L is a real mess. So far we only have "final" results through 5th order.

XSPEC fits are made to BND and focal plane detector spectra, after adjusting the emitted relative line intensities and continuum bremsstrahlung for detector QE, HRMA effic, grating effic, aperture collection effic, detector window effects, and beam nonuniformity. The derived line intensities are then compared for grating-in vs grating-out.
These plots have been updated since the review. There was a bug in the calculation of 0th order efficiencies that has been corrected. Agreement with model predictions is much improved.
In some cases, grating-out measurements with the appropriate HRMA configuration (shells 1346, 13, or 46) were not available. Results for those cases were derived using model HRMA effective areas, and are plotted using undersized red symbols. Results from the many Al-K measurements are not shown because nearly all suffered from systematic errors. We'll eventually separate the wheat from the chaff.
Agreement with the latest grating efficiency models is excellent, particularly for 0th and 1st order. Higher order results are undergoing further refinement. As an example of the tiny effects that must be considered, 2nd order Ag-L (4.16 Ang) overlaps with 1st order Al-K and 3rd order Ti-K. Because of 2nd order's extremely low efficiency, a contamination of only 0.1% Al-K (or perhaps this is just continuum emission) was enough to contribute about 25% of the detected focal plane counts for the Ag-L 2nd order LETG measurement. 3rd order Ti-K contributed about 10% of the counts.
Error bars have not yet been computed, but there is suggestive difference between measurement and model for the MEG 0th order at high energies, which may (??) have also been seen in flight data.


We also derived HRMA effective areas for various mirror-shell combinations by comparing focal plane and BND intensities. Results are in excellent agreement with previous analyses by Dick Edgar et al., as would be expected since the analysis methods are nearly identical (but independent). Our treatment of aperture and detector window effects is more detailed, but of little importance for nondispersed images.

Last modified: 06/14/02
|
The Chandra X-Ray
Center (CXC) is operated for NASA by the Smithsonian Astrophysical Observatory. 60 Garden Street, Cambridge, MA 02138 USA. Email: cxcweb@head.cfa.harvard.edu Smithsonian Institution, Copyright © 1998-2004. All rights reserved. |