

|
|
|

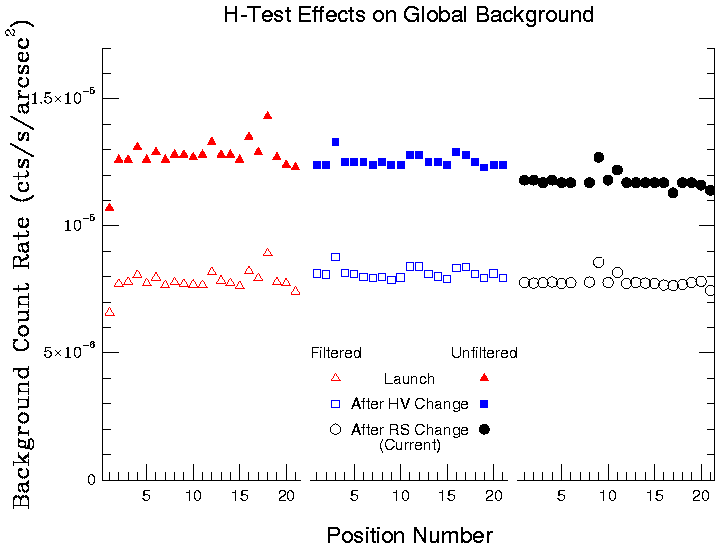
The unfiltered average background across the entire detector (excluding the source) remained relatively stable at a count rate slightly above 1.1e-5 cts/sec/arcsec**2. There is a decrease in the count rate (from 1.28e-5 to 1.25e-5 and thence to 1.12e-5 cts/s/arcsec**2) correlated to the change in the profile of the instrument. However, the first two data sets, with nearly indistinguishable background rates were collected during October, while the third, which is significantly lower (12%) was collected in December. This may indicate that the variation in the background rate is due to phenomena other than the changes in the instrument.
As can be seen from the accompanying plot, the H-test filter removes approximately 35-40% of the background counts, leaving a residual global (i.e. average) background count rate of just under 0.8e-5 cts/s/arcsec**2.
| Global Background | Background Near Source |
|---|---|
 |
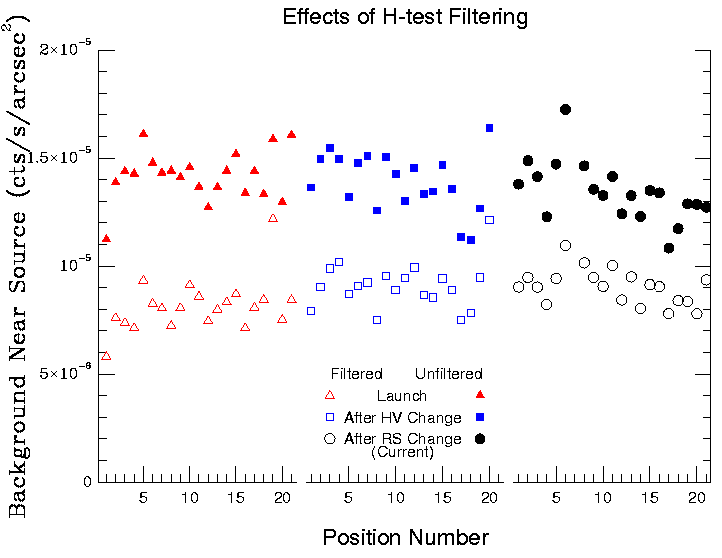 |
The "local" (within a radius of 700 pixels) background count rate near each source is consistent with the average/global count rate. The significant increase in the size of the variations is due to the much more localized sampling area of the detector and in fact is most likely attributed to local gain and qe variations.
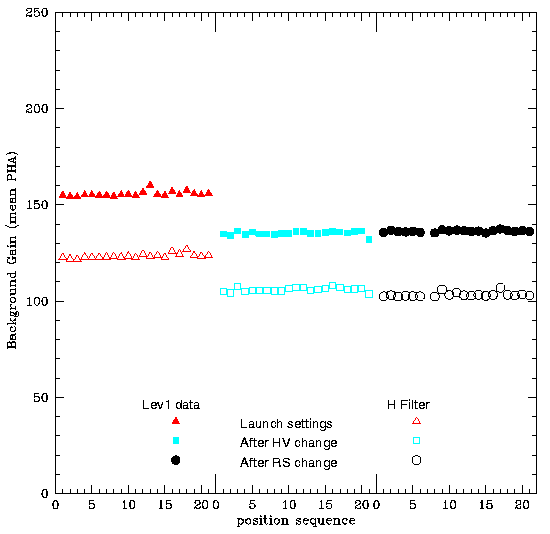
The mean PHA for the background nicely shows the change in the gain which occurred due to the lowering of the micro-channel plate high voltage in October '99. The bulk of the shift in the mean PHA that occurs due to the H-test filtering is because a large percentage of the events removed by the filtering process have a PHA=255.
| Mean PHA | Fraction of Events Least Sensitive Gain Setting (amp_sf=3) |
|---|---|
 |
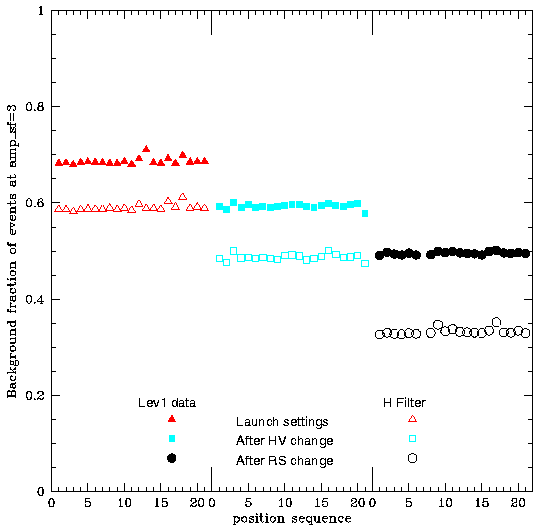 |
We also show the effect of the instrumental changes and the filtering on the percentage of events received with the least sensitive gain setting. In the event list files, these events have an amplifier scale factor (or amp_sf) value of 3. These events are most affected by the "ringing" in the HRC electronics. The data show that the profile changes in the instrument have substantially reduced this component in the background and that the H-test filtering also reduces this element.
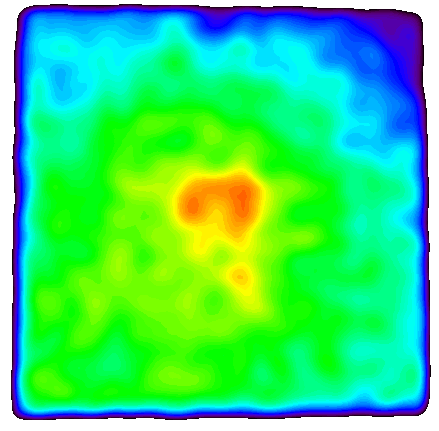
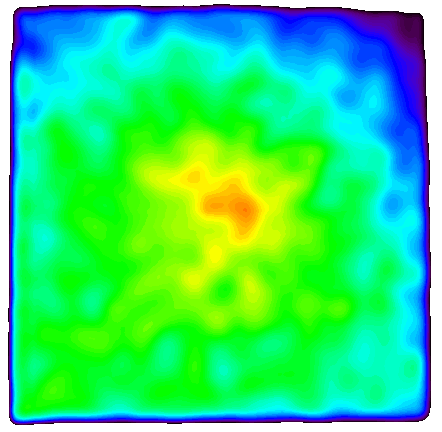
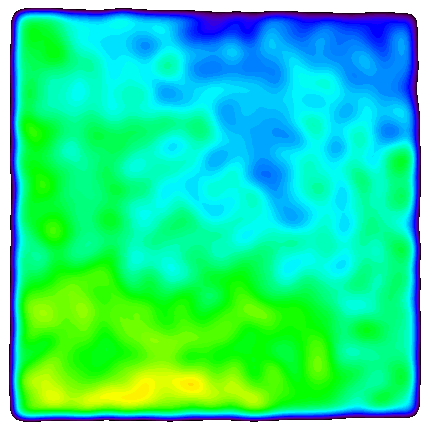
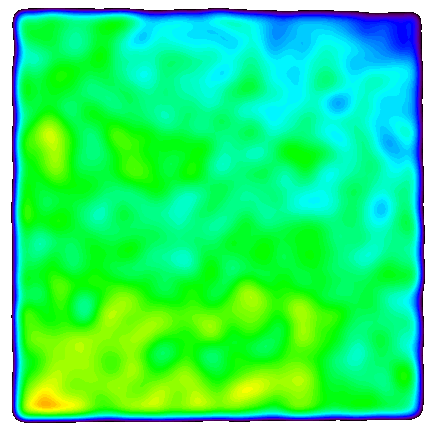
After first removing the sources from the data, the data were blocked 8x8 in degapped pixels and the average determined from the 21 pointings. These results were then further smoothed using a Gaussian with a sigma of 40 blocked pixels, corresponding to 320 raw pixels or approximately 40 arcsecs.
We present three different views of these results: a percentage
deviation from the mean, a 3-D projection of the count rate in
absolute units and a relative contour plot of the count rate.
In contrast the filtered data shows no such peak at center and is
better described as a tilted but relatively flat surface (please also
see the IPI
teams results). The data also indicates that the changes in the
instrumental profile have served to significantly improve the overall
character of the background.
Contributors:
Percent Difference from the Mean
Launch Settings
After HV Change
Current Settings
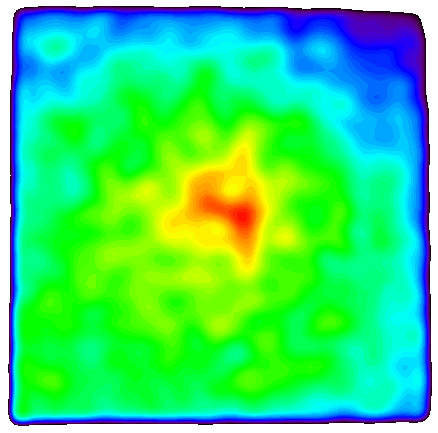
Unfiltered
Unfiltered
Unfiltered
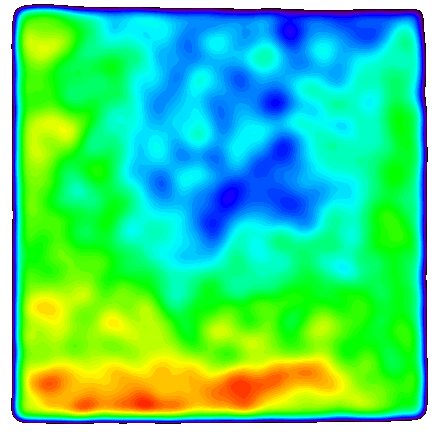
Filtered
Filtered
Filtered
CXC Calibration Team
HRC IPI Team
Comments to
cxccal@cfa.harvard.edu
|
The Chandra X-Ray
Center (CXC) is operated for NASA by the Smithsonian Astrophysical Observatory. 60 Garden Street, Cambridge, MA 02138 USA. Email: cxcweb@head.cfa.harvard.edu Smithsonian Institution, Copyright © 1998-2004. All rights reserved. |
Last modified: 09/25/12