Analysis of Un-De-Dithered Focus Plates
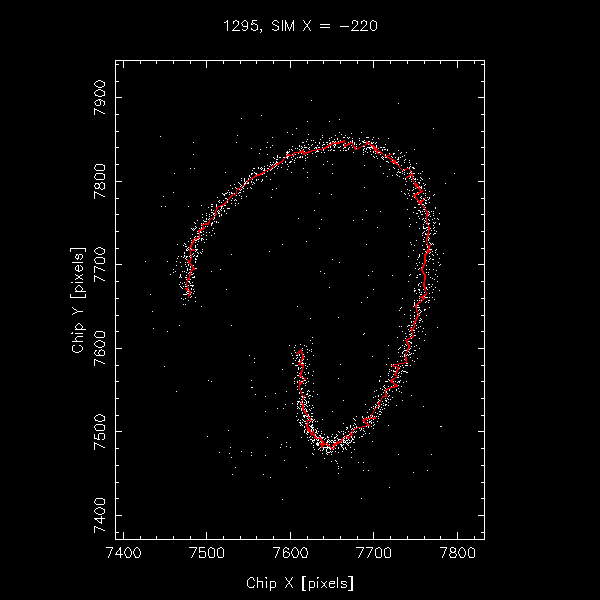
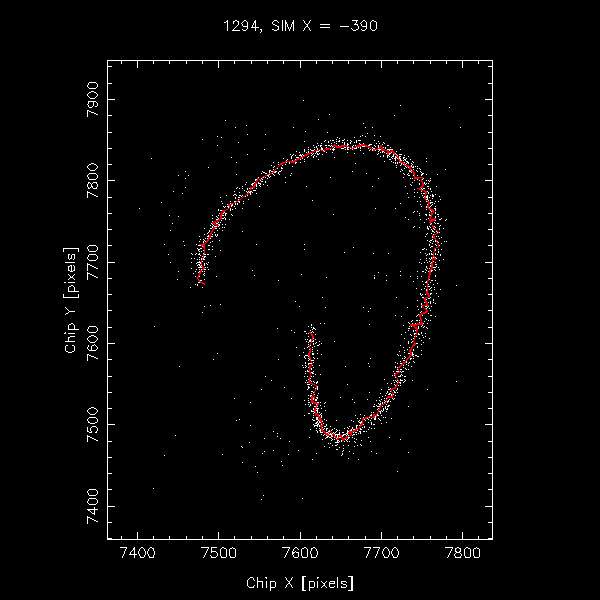
I've performed a simple analysis of the width of the trail in
the un-de-dithered HRC-I focus plate images. The analysis is
as follows
- the exposures were divided into one second time slices, and
the image center of each slice determined using a
sigma-clipping algorithm, with a 1 sigma clip radius.
- the distance from each event to the center for its time
slice was determined
- distances which were greater than 20 pixels from the
derived center were tossed, to get rid of background events.
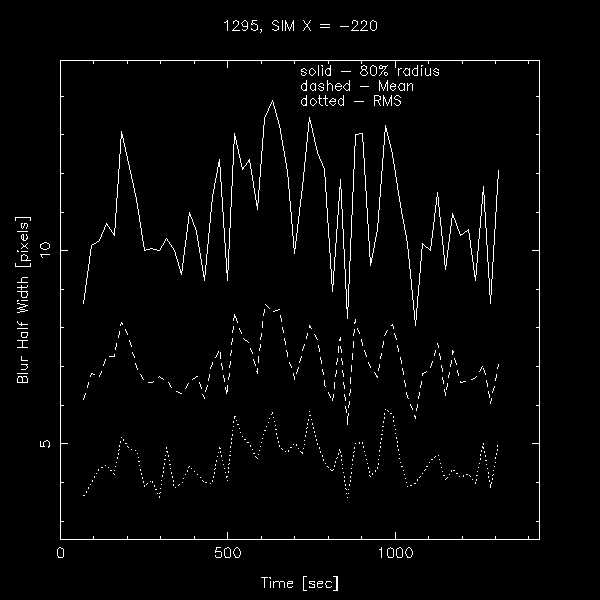
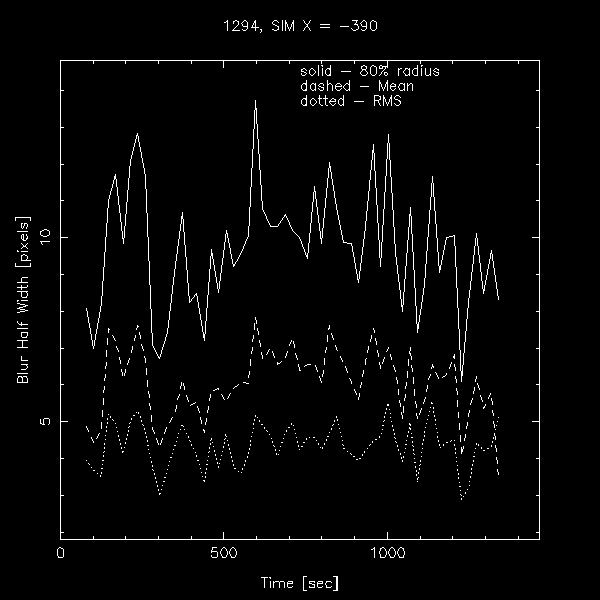
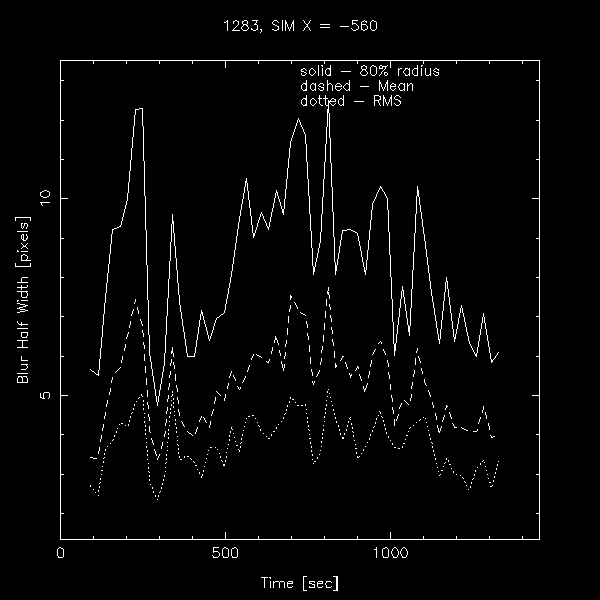
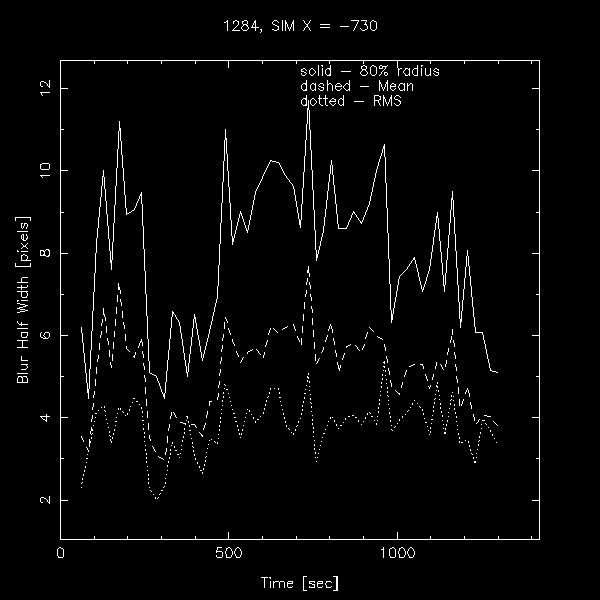
- the distances were then grouped into 15 second
slices. slices with less than 20 events were tossed.
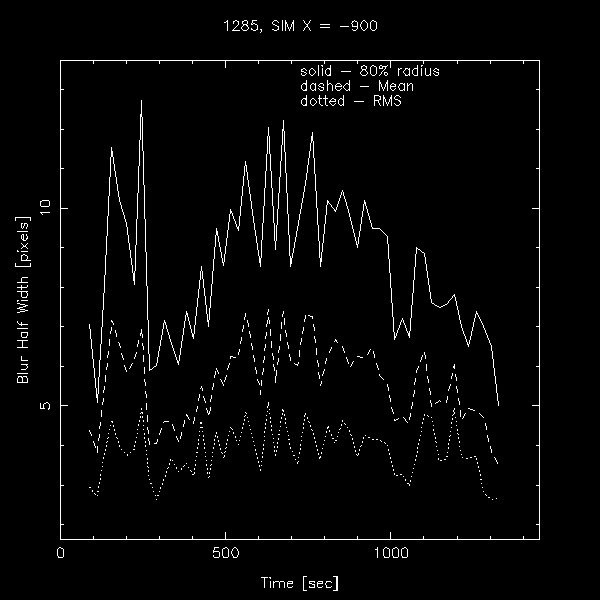
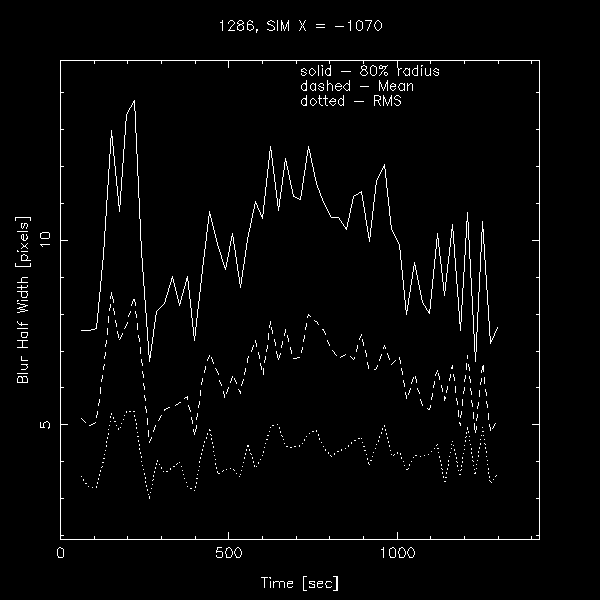
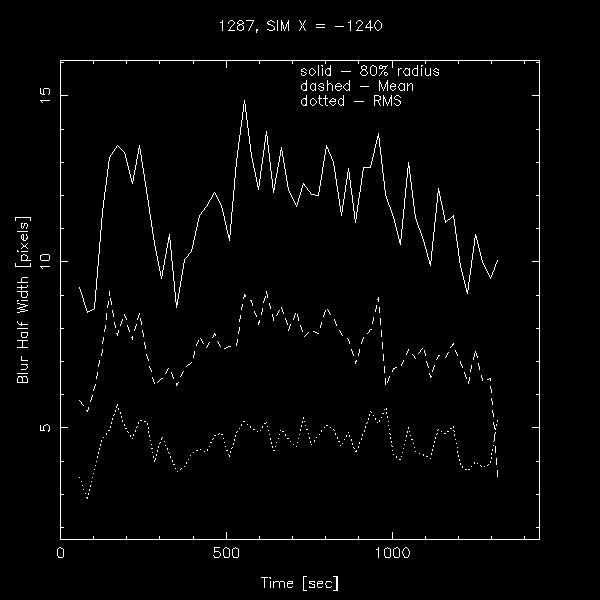
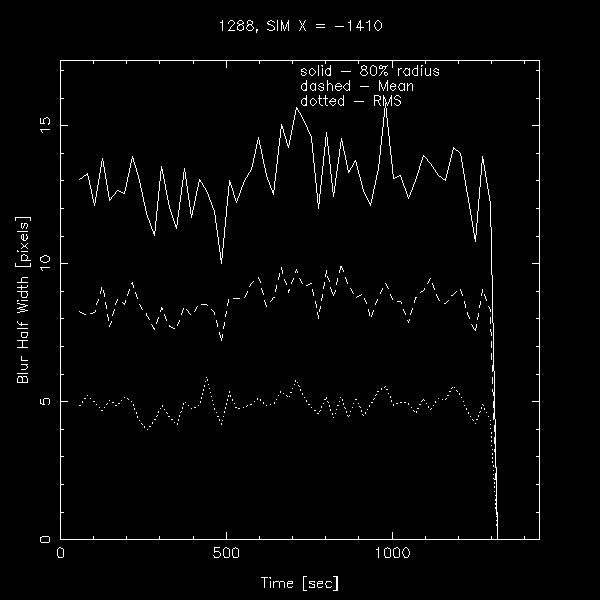
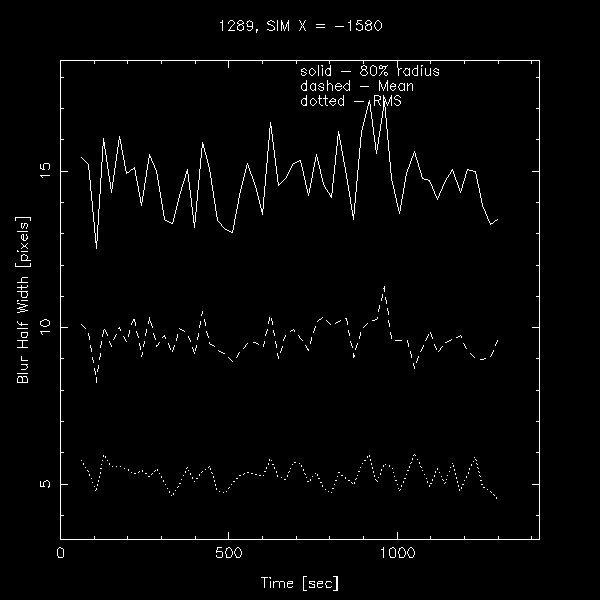
the mean, RMS, and 80% half width of the remaining
slices was determined.
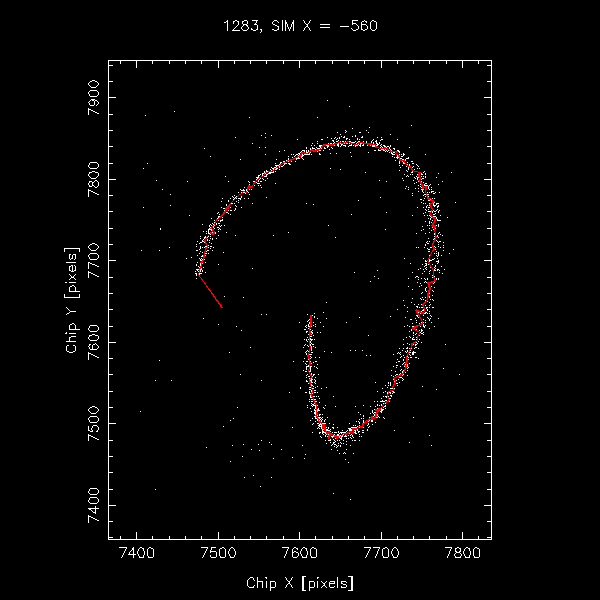
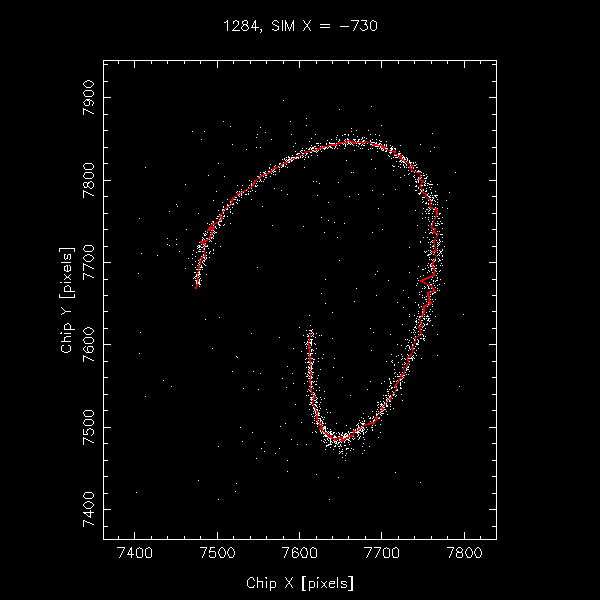
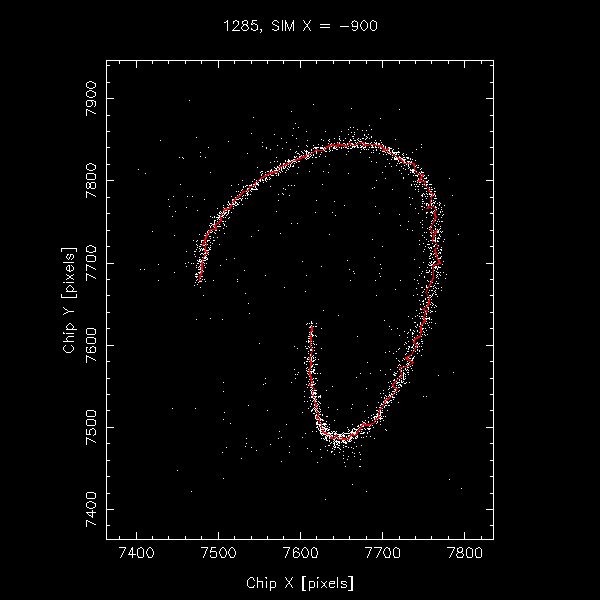
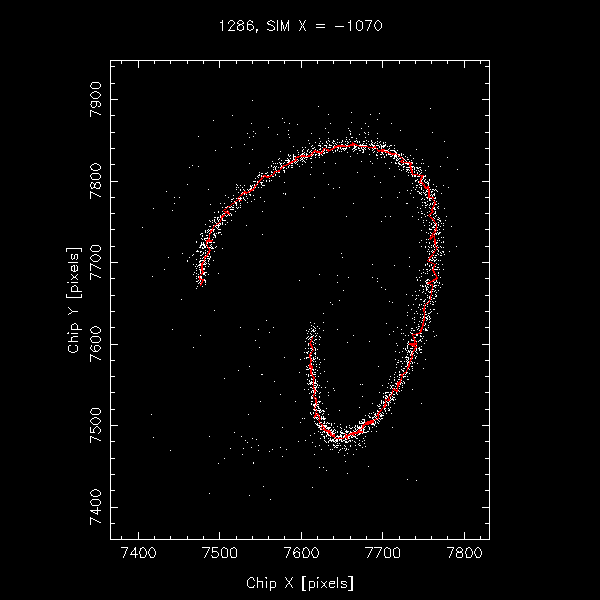
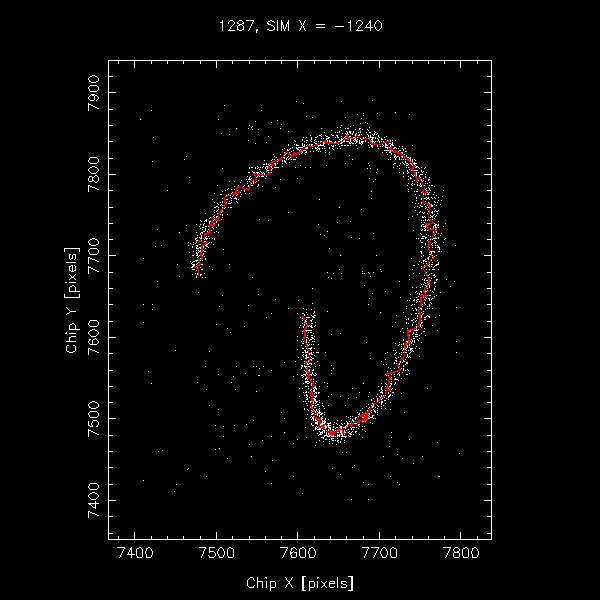
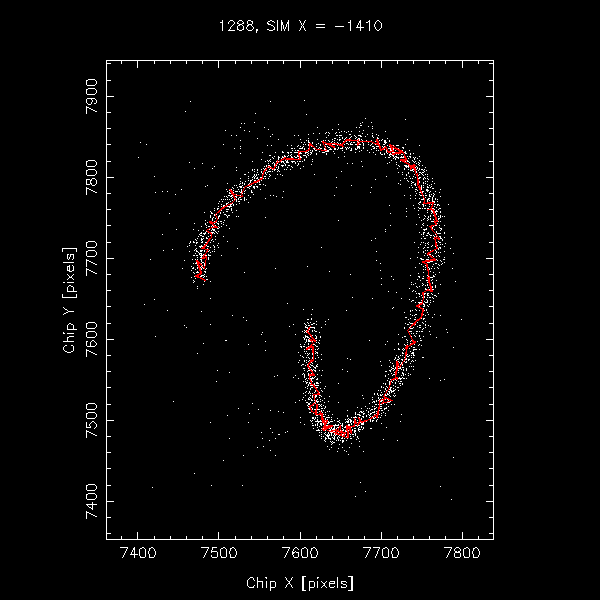
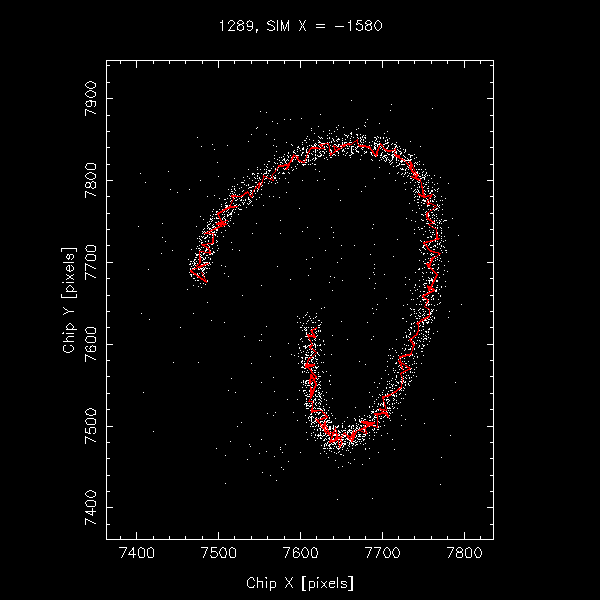
Spot diagrams and the statistics are plotted below. The center
of the time slices is plotted on the spot diagram.
Diab Jerius
Last modified: Fri Sep 3 09:57:40 EDT 1999


