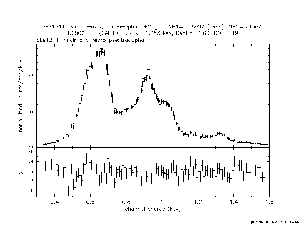
Figure 1
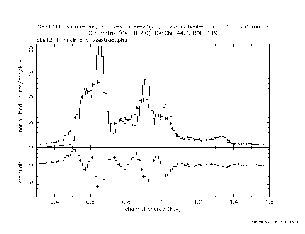
Figure 2
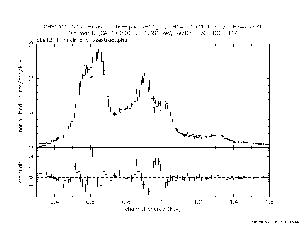
Figure 3
This document describes the new (August, 2001) release of ACIS response products (FEF, Fits Encoded Function, and gain files) for the back-illuminated (BI) chip S3 at a focal plane temperature of -120 C, which has been the default operating temperature since January 2000. Release of new FEF & gain files for the S1 chip and S3 at -110 C will follow soon (expected later in August, 2001).
Files discussed:
acisD2000-01-29fef_piN0002.fits
acisD2000-01-29gainN0003.fits
acisD2000-08-12gainN0003.fits
acisD2000-07-06gainN0003.fits
acisD2000-07-04gainN0003.fits
acisD2000-01-29fef_phaN0002.fits
The previously released ACIS response products (referred to throughout as N0001 after the version number in the response file names) modeled the response of the ccd as multiple Gaussians(1-3, as originally needed): one for the main peak, and, if needed (for energies above about 1.5 keV) one for the Si K-alpha escape peak (at the main peak energy minus 1.74 keV), and one for the Si K-alpha fluorescence peak (1.74 keV).
The present release, N0002, for the S3 chip only, models the response as up to ten Gaussian components: the 3 as above plus additional Gaussian components which account for the non-Gaussian shape of the actual response. We have attempted to model the partial charge collection feature (a "shelf" from zero pulse height up to the main peak), the non-Gaussian wing on the hard side of the main peak, and the very soft response near the event threshold.
This work was done using a high fidelity physical Monte-Carlo ACIS simulator developed by Gregory Prigozhin (of the MIT ACIS PI team): G.Prigozhin, et al. SPIE Proceedings, vol. 3444, pp. 267-275, (July, 1998). We ran of the order of 108 events through this simulator, which runs the flight event finding algorithm on the resulting images, and generates an event list for further analysis. For the S3 chip, these events were subdivided into 32x32 pixel "tiles" covering the chip, to allow for variations of the instrument response across the chip (mostly due to charge transfer inefficiency, CTI). Histograms of the resulting pulse height distributions were prepared.
We then fit the model described above to the 14,492 pulse height distributions. The resulting model fit parameters (centroids, widths, and amplitudes of the 10 Gaussian components), known as an "Electron Charge Distribution" (ECD) file were then transformed into standard-conforming FEF files.
The external calibration source flight data contains strong Al K-alpha (1.486 keV), Ti K-alpha and K-beta (4.51 and 4.93 keV), and Mn K-alpha and K-beta (5.90 and 6.49 keV) lines. We fit models to each tile's worth of data using the provisional FEF files, and derived energy (gain) errors. These were then fed back into the ECD files, new FEF files were produced, and the fitting was repeated. The process stops when all tiles fit the K-alpha lines with energy errors less than 0.3%. We were able to exceed this standard by a substantial factor. We present here the deviation map file and a table of statistics for the final released version of the PHA FEF. Statistics for the PI FEFs and selected plots for both PHA and PI will be presented here in the near future.
To produce PI (pulse-height invariant, i.e. gain adjusted) response products, the gain file is first derived. NOTE: This gain file differs from the N0001 version, which may have been used in the pipeline processing. It is therefore necessary to re-run acis_process_events to prepare the Energy and PI columns for analysis in your data. ( Apply an ACIS Gain Map Thread) The gain file is derived by obtaining from the model runs the mean PHA value for all simulated photon events with a given energy. Energies are then interpolated from PHA values from this table. The table is larger in N0002 than before, necessitating a new, patched version of acis_process_events. ( CIAO 2.1.3 Patch Announcement)
PI is then defined to be
| Energy (keV) | Line | Node | Average Error (%) | Maximum Error (%) | Median Error (%) |
|---|---|---|---|---|---|
| 1.49 | Aluminum K-alpha | 0 | 0.025 | 0.150 | 0.022 |
| 1.49 | Aluminum K-alpha | 1 | 0.006 | -0.116 | 0.006 |
| 1.49 | Aluminum K-alpha | 2 | 0.004 | 0.131 | 0.0015 |
| 1.49 | Aluminum K-alpha | 3 | 0.003 | 0.118 | 0.001 |
| 4.51 | Titanium K-alpha | 0 | 0.005 | -0.029 | 0.004 |
| 4.51 | Titanium K-alpha | 1 | 0.006 | -0.040 | 0.005 |
| 4.51 | Titanium K-alpha | 2 | 0.009 | 0.049 | 0.007 |
| 4.51 | Titanium K-alpha | 3 | 0.019 | 0.426 | 0.015 |
| 5.9 | Manganese K-alpha | 0 | 0.003 | 0.032 | 0.002 |
| 5.9 | Manganese K-alpha | 1 | 0.004 | 0.019 | 0.004 |
| 5.9 | Manganese K-alpha | 2 | 0.006 | 0.024 | 0.005 |
| 5.9 | Manganese K-alpha | 3 | 0.008 | 0.021 | 0.007 |
| node0dif.txt | node1dif.txt | node2dif.txt | node3dif.txt |
As a part of the calibration program, we have obtained six pointings on the S3 chip at -120 C at the young, oxygen-rich supernova remnant 1E0102-72.3, alias E0102. This the x-ray emission from this supernova remnant (SNR) in the small magellanic cloud is dominated by the reverse shock propagating into the supernova ejecta, which seem to be made up almost exclusively of oxygen and neon. Observations with the Chandra HETG and XMM-Newton RGS show many lines of hydrogenic (single-electron) and helium-like (two electron) ions of oxygen and neon, with a smattering of similar ions of heavier elements (Mg, Si). There may also be a continuum due to thermal Bremsstrahlung.
Recent papers on the x-ray emission from E0102:
The data from these observations were fit to a model consisting of 24 narrow Gaussians (representing lines seen in the grating observations) plus a thermal Bremsstrahlung continuum, with absorption in two components, one with Galactic abundances and a fixed column density NH1=5.36x1020 cm-2, and one with SMC abundances and a floating column density. The energies of the lines were fixed to the known values, but intensities were allowed to float. Fitting tends to make the softest of the oxygen lines, the forbidden O VII line at 561 eV go to zero, unlike what the grating data show. This probably indicates a residual problem with the energy scale
We present model fits using data from obsid 1311, which was near the aimpoint on S3, taken at a focal plane temperature of -120 C. We extracted data from the bright, reverse-shock, ring of x-ray emission using the following region file.
physical;annulus(4172.75,4244.25,22,35) # source region
physical;rotbox(4226.75,4317.75,117.5,54.5,324.49206) # background
physical;rotbox(4126.25,4172.25,130.5,51.5,324.24071) # background
The extracted data were then regrouped to have a minimum of 50 events per bin. The fit extended from 0.3 to 5 keV. Note that the few events coming from the continuum above 2 keV have a significant impact on the temperature parameter in the bremsstrahlung continuum component in the model.

Figure 1 | 
Figure 2 | 
Figure 3 |
We present only 3 plots for now (further updates are forthcoming). Figure 1 shows a fit in PHA space using the N0002 response matrix. Note that the residuals are basically flat and consistent with zero down to about 750 eV. There are systematics in the residuals below this energy, notably around the oxygen VIII Lyman alpha line, and the strong oxygen VII helium-like triplet. Ongoing research may lead to a future release which will attempt to smooth these systematics further.
In figure 2, we present this same model folded with the N0001 response. No re-fitting was done. This figure shows that the lines in the N0001 response model are both too narrow and in the wrong place, as has been noted before.
Figure 3 represents a fit to the multi-line model using the N0001 response. The residuals around the lines are large and significant, and the fitted parameters differ as well [NH2 = 2.7 vs. 8.6 x 1021 cm-2; kT=0.38 vs. 1.253 keV).
Another calibration target is the supernova remnant G21.5-0.9, which we will refer to as G21.5. Unlike E0102, the spectrum of this supernova remnant appears to be a continuum, presumably due to synchrotron radiation. It is also heavily extincted, with a column density of 2-3x1022 cm-2. This large interstellar column absorbs essentially all of the photons below about 1.2 keV.
A paper on Chandra observations of this object has appeared in the literature: Slane et al. 2000 ApJL, 533, L29, (2000).
We have fit an ACIS-S3 observation (obsid 1838) of the supernova remnant G21.5-0.9 with an absorbed power-law model in Sherpa. This 9.6 ksec observation was at a focal plane temperature of -120C, and we have compared the fit results using the newly released FEF and gain for -120C with the previously released versions. The source region is:
The background was chosen from the outer regions of the chip to avoid the extended low surface-brightness halo. The background regions are:
physical;ellipse(4071,4249.5,9.0955017,5.7600433,42.166038) # ds9 screenshot of region
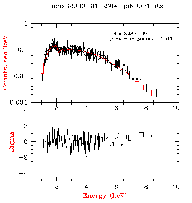
We then fit the spectrum in PI and PHA space, using both N0001 and N0002 FEF-derived response matrices for a tile near the center of the remnant. The model used is a simple absorbed power law. We show the fitted parameters (column density, power law index, normalization) in the table below.
physical;circle(3901,4700,90) # background
physical;circle(4230,4720,90) # background
physical;circle(4479,4584,90) # background
physical;circle(4518,4146,90) # background
| gain | ndata | nH | gamma | ampl | chisqr | reduced |
|---|---|---|---|---|---|---|
| acisD2000-01-29fef_phaN0001.fits | 186 | 2.3910 | 1.4812 | 0.0020 | 105.294 | 0.575376 |
| acisD2000-01-29fef_phaN0002.fits | 186 | 2.5674 | 1.5445 | 0.0022 | 105.075 | 0.574181 |
| acisD2000-01-29fef_piN0001.fits | 166 | 2.4894 | 1.5166 | 0.0021 | 99.1737 | 0.608428 |
| acisD2000-01-29fef_piN0002.fits | 167 | 2.5376 | 1.5345 | 0.0022 | 98.9245 | 0.603198 |
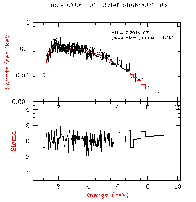
pha fit to G21.5 using old FEF | 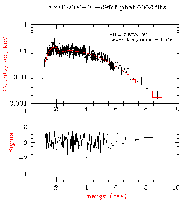
pha fit to G21.5 using new FEF |
pi fit to G21.5 using old FEF | 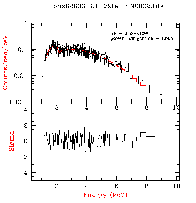
pi fit to G21.5 using new FEF |
NOTE: Note that we get rather similar NH and gamma values with both old and new FEFs, with perhaps a trend toward larger NH values with the new release.
Each spectrum was grouped so there were 15 counts in every bin, and the energy was restricted to the range 0.3-10.0 keV. The Chi-Squared Gehrels fit statistic was used, along with the Powell optimization method. This exercise should give the user a feel for how much the change in the response may impact fitted values, especially the absorbing column density NH for column densities of this order of magnitude (a few times 1022 cm-2).
We present fits to the spectrum of a cluster of galaxies, from Wise et al. (2001, in preparation). The fits were done with PI events and FEFs, using both the N0001 and N0002 FEFs. The model is a two-temperature MEKAL model, with foreground Galactic absorption, using xspec. The fit parameters are not very different, as can be seen in the table.
| FEF | NH (1020/cm2) | kT1 (keV) | kT2 (keV) | redshift | reduced chi2 |
|---|---|---|---|---|---|
| N0001 | 5.42 +/- 0.27 | 0.53 +/- 0.04 | 4.77 +/- 0.16 | 0.2999 | 1.13 |
| N0002 | 5.86 +/- 0.40 | 0.44 +/- 0.10 | 4.64 +/- 0.11 | 0.3065 | 1.23 |
The major difference in this case is in the redshift, derived from the fit to the iron K feature visible at about 5 keV in the data. The canonical redshift for this cluster is 0.313. The residuals in the old FEF fit may show more systematic ripples, but the effect is not striking.
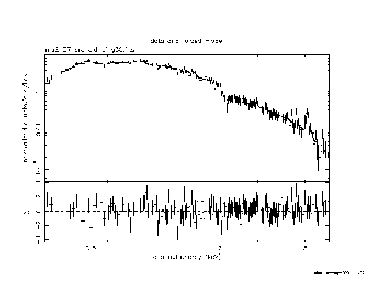
pha fit to MS 2137 using old FEF | 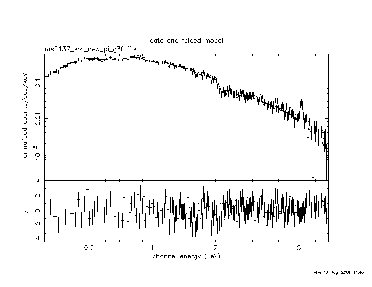
pha fit to MS 2137 using new FEF |
Thanks to the ACIS RMF Generation Dramatis Personae