dmlist acis_obs_evt2.fits header | grep DATE-OBSwhere acis_obs_evt2.fits is the name of your reprocessed evt2 file, will return the date of your observation. In the case of obsid 3520, a value of:
0012 DATE-OBS 2003-02-01T07:10:08 String Date and time of observation startWe have supplied a quick Perl script to convert the date of your observation to Day Of Year: dates.perl
When run for this observation will produce:
-> ../dates.pl 2003 02 01

Entered date is: 02/01/2003
Day of year 2003 is: 32
Check observation list for: 2003:032
Note that this task can also be accomplised using the CIAO tool prop_dates. A quick check of the list of available ECS observations yields:
Time	OBSID	Chips	FP Temp	 Description
.
.
2003:028:2210	60868	i0-i3,s2,s3	-121	faintmode(musicalfeps)
2003:031:1411	60865	s0-s5	-121	faintmode(musicalfeps)
2003:036:2313	60856	i0-i3,s2,s3	-121	faintmode(musicalfeps)
.
.
Accordingly obsid 60865 would be the best choice to compare our data against as it is one day difference in time.
- Down load level 1 & 2 event files.
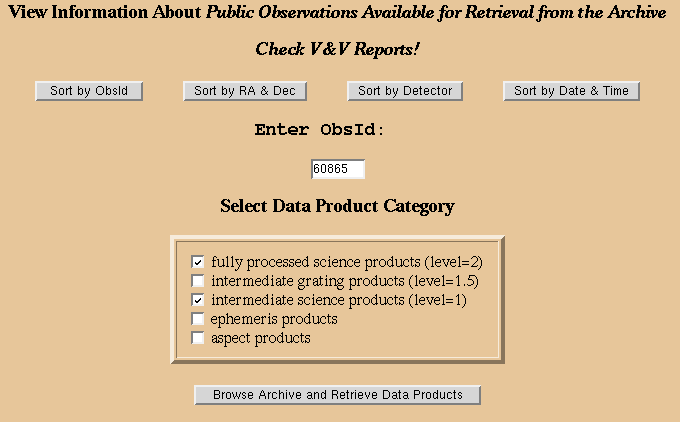
The files for observation 80865
Filename                                FileSize(bytes)          File_TimeStamp

--------------------------------------------------------------------------------

acisf60865_000N001_evt2.fits                   55900800    2/3/2003 21:49:06:566

acisf60865_000N001_full_img2.fits               4348800    2/3/2003 21:48:43:746

acisf60865_000N001_evt1.fits                   95365440    2/3/2003 21:42:06:663

acisf60865_000N001_flt1.fits                     311040    2/3/2003 21:41:16:220

acisf60865_000N001_msk1.fits                     216000    2/3/2003 21:41:16:726

acisf60865_000N001_mtl1.fits                    1604160    2/3/2003 21:41:17:740

acisf60865_000N001_bpix1.fits                    129600    2/3/2003 21:41:14:826

acisf60865_000N001_stat1.fits                    648000    2/3/2003 21:41:15:236

--------------------------------------------------------------------------------

Combined File Size (uncompressed) is 158.52384 MB
This information can be obtained from viewing the observation list. As seen above in step one:
2003:031:1411 60865 s0-s5 -121 faintmode(musicalfeps)It contains data on the S-array. The E0102-72.3 observation was taken on the S3 chip, so it contains data in the correct location.
- Ensure the data from both the celestial target and the external calibration source have been properly reprocessed using the same version of CIAO and the CALDB.
Since the ECS data does not come with an ASOL file, an extra command must be given in order to run acis_process_events on these data:
punlearn acis_process_events
pset acis_process_events infile=ecs7_60865_evt1.fits
pset acis_process_events outfile=ecs7_60865_APE_evt1.fits
pset acis_process_events acaofffile=NONE
pset acis_process_events eventdef=")stdlev1"
pset acis_process_events apply_cti=no

-------> pset acis_process_events stop=NONE <---------

acis_process_events
Note: the above file ecs7_60865_evt1.fits is a copy of the file acisf60865_000N001_evt1.fits, which has been filtered on ccd_id=7. This is the same chip which the E0102-72.3 observation is on, and is done simply to decrease the file size and increase processing speed.
Once TGAIN has been applied dmextract should be applied to get spectral files from the ECS data. The RMF created for the observational data should be sufficient for use with ECS data assuming the source region is not large, Arf's are unnecessary and cannot be calculated for the ECS data. However, when applying dmextract, additional chip area must be taken into account. Due to dithering of the telescope, an extraction region covers a larger portion of the ccd. Therefore dmstat should be run on the source extraction region to determine the maximum and minimum of the chipx and chipy values. These then may be used for creation of spectra and if necessary an RMF:
dmstat "acis_evt2.fits[sky=region(e0102_source.reg)]" | more
chip(chipx, chipy)[pixel]
    min:        ( 300 439 )           @:        33879
    max:        ( 438 575 )           @:        12350
   mean:        ( 368.2327132 506.96554988 )
  sigma:        ( 24.186114875 23.191141243 )
    sum:        ( 17893164 24634470 )
   good:        ( 48592 48592 )
   null:        ( 0 0 )

dmcopy "ecs7_60865_evt2.fits[chipx=300:438, chipy=439:575]" ecs7_60865_src_evt2.fits clobber=yes

punlearn dmextract
pset dmextract infile="ecs7_60865_src_evt2.fits[bin pha=1:4096:1]"
pset dmextract outfile=ecs7_60865_pha.pha
pset dmextract clobber=yes
dmextract
Where acis_evt2.fits is your reprocessed evt2 file and e0102_source.reg is your source region file.
The RMF used for your initial observational data should be sufficient for fitting with ECS data.
However, if your source is largely extended or dithers across multiple nodes, an additional RMF
should be created. Additionally it is important to note that the energy scale and binning used
in dmextract match exactly the binning and scale used in your source RMF. This information
should be available in the headers of the Source RMF.
For obsid 60865, the fits for the ECS to the strong lines can be seen:
Al K (1487 eV)
Ti K-alpha (4510 eV)
Mn K-alpha (5898 eV)
A single Gaussian was used in each range for the lines, the normalization and line energies were allowed to float and the line widths were kept to zero. Each fit returned the exact energy for the line. As is evidenced in the plots, the lines fit these data nicely and we can conclude that with the use of TGAIN, the standard ACIS calibration files provide a good fit.