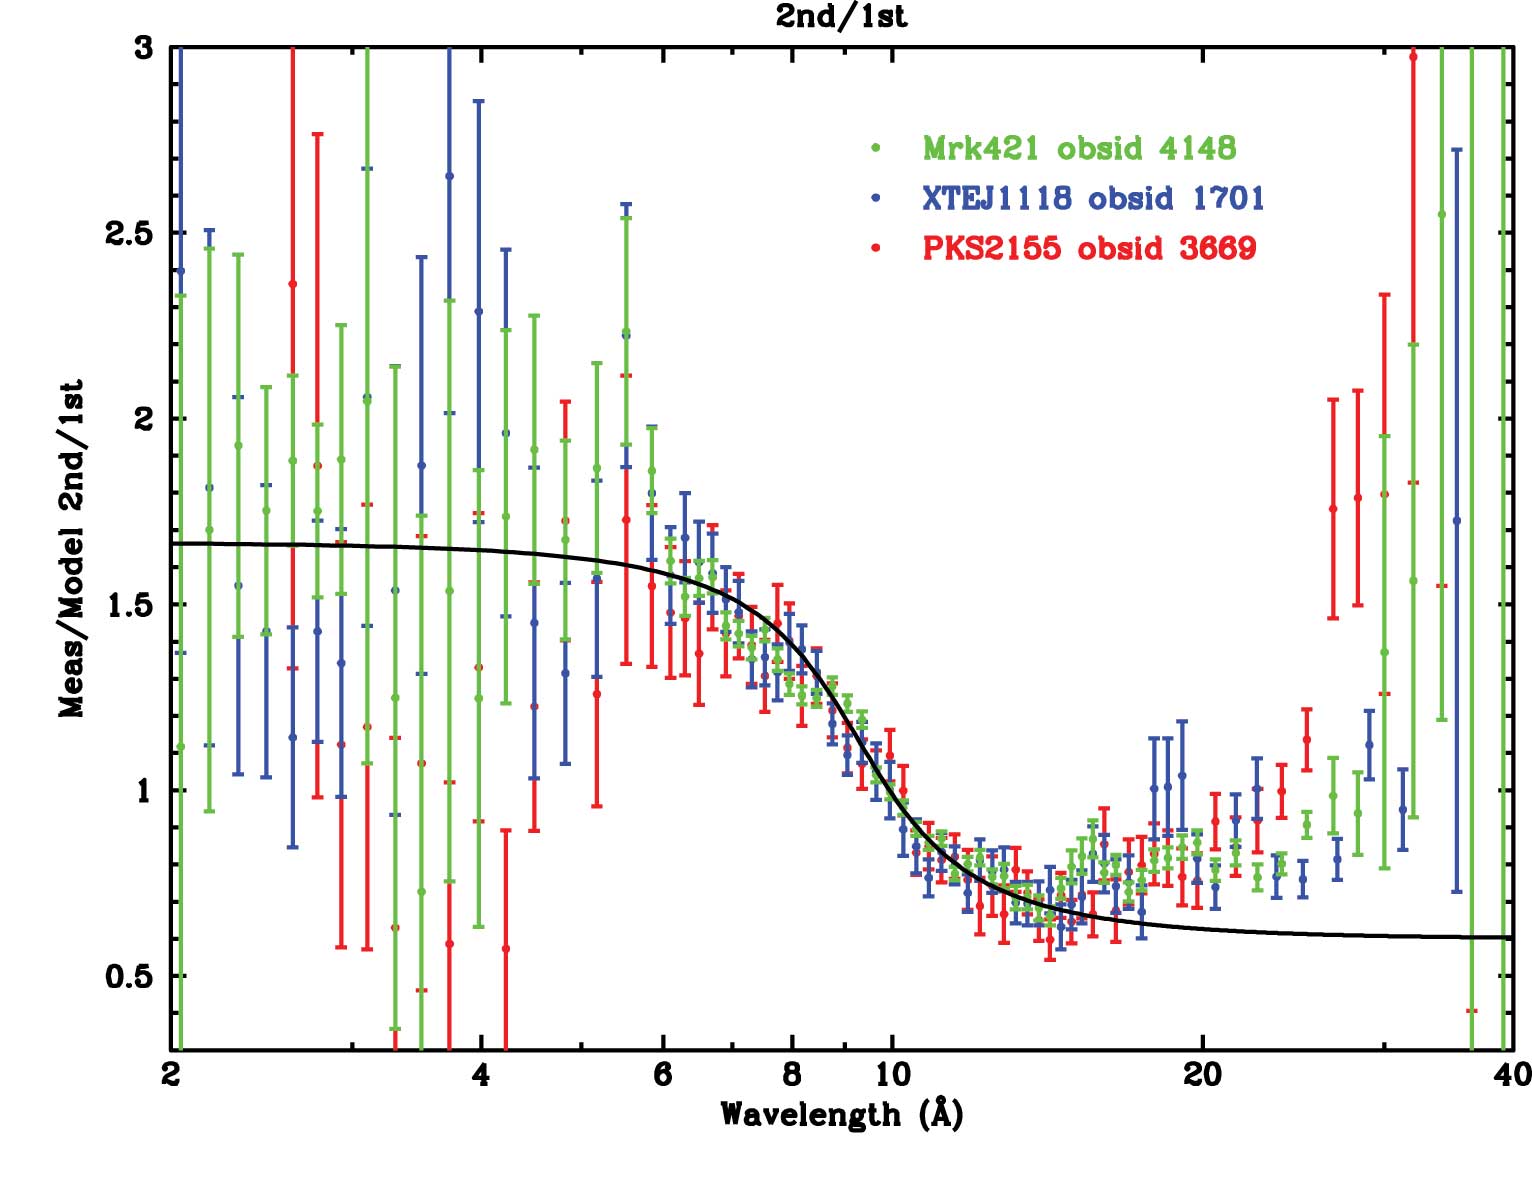
Figure 11: Comparison between measured and model ratios of 2nd-order LETG diffraction efficiencies (figure courtesy of Brad Wargelin).
At a Chandra workshop over a year ago, I was recounting progress in LETG calibration to a colleague and caught myself saying that the instrument was "nearly calibrated". This immediately brought to mind sayings of my grandmother's, one of which was "in my day you could go to town with threepence ha'penny, buy an X-ray mirror and detector system and launch it all and still have change for a fish n chip supper". (That times have changed was dramatically brought home on July 23, 1999 with the launch of Chandra - no change at all from threepence haŐpenny and none of us got a fish n chip supper.) The saying that I remembered though was "nearly's not half way!". As in "yes, grandma, we've devised a cross-correlation technique to map out imaging non-linearities in the detector and the analysis is nearly finished". "Well my boy, nearly's not half way! Now shut up and finish your tripe and cabbage".
By "nearly calibrated", I had meant that the remaining significant problems with understanding the performance - effective area, dispersion relation and line response function - seemed tractable and that we were well on the way to having new calibration products available. It has of course taken until now to get the final calibration products released.
Revised Diffraction EfficienciesFirst came new LETG diffraction efficiencies for higher orders, which were released in August 2004. It had become apparent that the effective area in the vicinity of edges of instrumental origin seen in the higher orders in continuum sources was not correct. In principle, one could tease out corrections to the diffraction efficiencies using LETG+ACIS-S in-flight observations. Such an analysis was made more entertaining by given wavelengths in different orders appearing on different chips, both front- and back-illuminated, and by significant pile-up in the brightest spectral regions. Residual absolute ACIS QE uncertainties rendered the exercise one for abstract artistic wonder as much as for improving calibration. Long-awaited ACIS QE revisions, however, and further pile-up correction refinements enabled Brad Wargelin to derive corrections to efficiencies for orders 2-7. Corrections to even orders were largest - not surprising since these efficiencies should be precisely zero for a perfectly manufactured grating, and the small but finite efficiencies are painfully sensitive to small departures from perfection. The correction factor for 2nd order is the largest and is illustrated as a function of wavelength in Figure 11 (see also Wargelin et al. 2004).
Uncertainties in the HRC-S QE at launch meant that the effective area of this instrument has largely been re-calibrated in-flight. This process involved use of the LETG to obtain dispersed spectra of hot white dwarfs for use as standard candles at longer wavelengths, and bright, power law continua toward shorter wavelengths. Revision of the diffraction efficiencies meant that the calibration of the HRC-S QE was no longer perfectly consistent with observations and thus also needed revision. At the same time, work was already underway to use flight data to improve the laboratory-based QE uniformity map of the detector. Both the revised QE uniformity map and QE itself were released in CALDB v3.0.1.
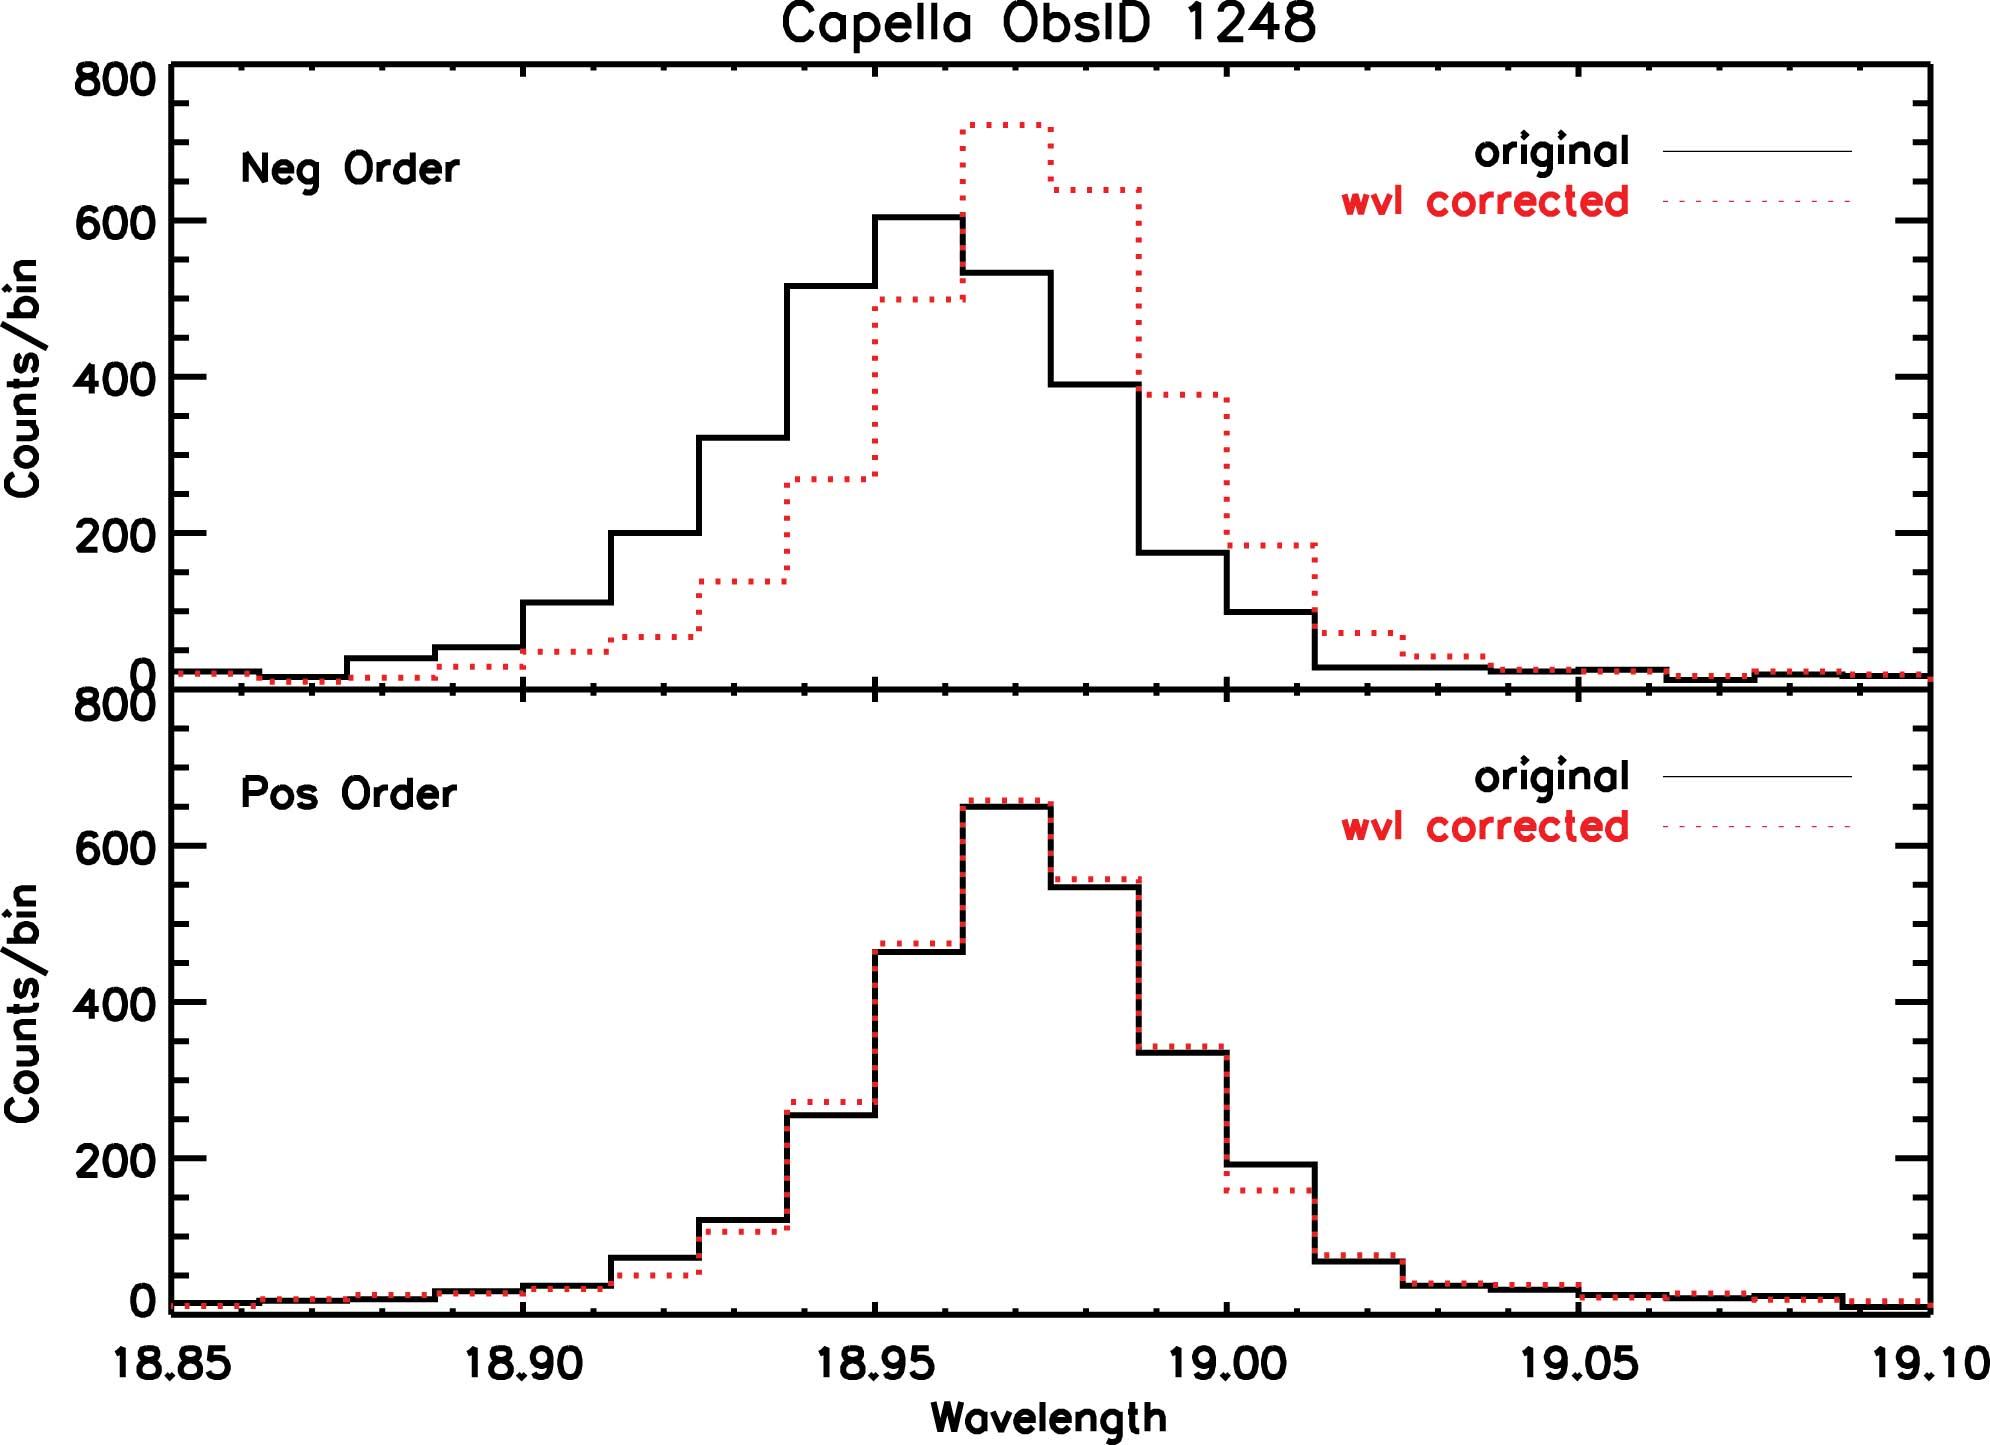
Correcting HRC-S Imaging Non-LinearitiesIn earlier Newsletters, I have described some artifacts of the HRC-S imaging characteristics that lead to distortion and non-linearity of the dispersion relation and distortion of line profiles. We have been working on a way to correct for these effects for some time. These distortions probably arise because of subtle differences in the different amplification stages applied to different detector taps (essentially the different wires in the cross-grid used to detect the charge cloud generated by a photon event and subsequent electron cascade in the microchannel plate). Ab initio correction for this effect might have been possible if we could perform further laboratory experiments on the detector, but flight data are almost certainly insufficient for this. We are therefore left with the problem of deriving empirical corrections from what flight data we have and can realistically obtain.
Given about a megasecond of calibration time, it would be
possible to observe a bright line source, such as Capella, at
different off-axis angles and use the detector positions of
spectral lines with known wavelengths to map out fairly
completely the event position distortions. As it is, existing
GO and calibration observations have allowed us to do this to a
limited exent: we have been able to derive event position
corrections over most of the central plate and some small
regions of the outer plates. A Perl script written by Pete
``Wonderscript" Ratzlaff to apply these corrections to standard
level 1.5 or 2.0 files was released on the CXC user-contributed
software site in December 2004
(http://cxc.harvard.edu/cont-soft/software/corrlam.1.0.html).
The effects of applying this script are quite visible for some lines, as illustrated for the H-like O Lya doublet seen in Capella in Figure 12.
We continue to work to refine the event position corrections, and the software group is currently attempting to ingest the algorithm and associated correction data into CIAO for more seamless application.
The X-ray Forest as a Renewable ResourceIt's getting more and more difficult for us stellar physicists to make fun of cosmology these days. The X-ray analogue of the Lyman-alpha forest is a bit more tricky to observe than its UV-optical counterpart. The resolving power of the LETGS is 300-500 in the region of the O, N and C lines of interest, and the intrinsic absorption line profiles are far from being resolved. Contrast between lines and continuum is therefore much reduced and photons entering the modest effective area to populate the continuum with signal are somewhat sparse - you can't see the forest for the trees.
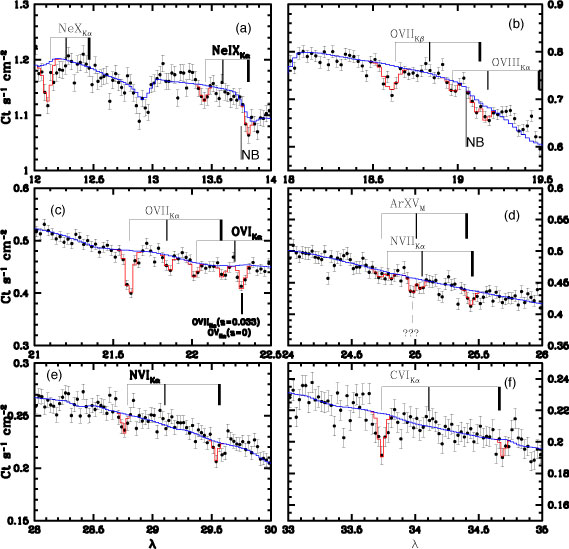
Nevertheless, Nicastro et al. (2005) have recently succeeded in detecting X-ray absorption features in the warm-hot phase of the intergalactic medium (WHIM) in the line-of-sight toward the blazar Mkn 421 (Figure 13). The observations were obtained on 26-27 October 2002 and 1-2 July 2003 as a target of opportunity when the blazar was especially bright in X-rays, and provide insight into that thorny problem of the ``missing baryons". While the number of baryons detected at early times (redshifts z > 2) is in accord with recent cosmological measurements, and with predictions from studies of the production of the lightest elements, closer to our own epoch (z < 2) the number of baryons detected add up to just over half (~55%) that expected - about ~45% appear to be missing. The amount of hot, ionized matter seen in absorption in the LETGS spectra indicates that this phase, which is essentially invisible at other wavelengths, has a mass density consistent, within the uncertainties, with the mass density of the missing baryons. The missing baryons might then have been found. Or nearly, at least.
Observer and proposer information and news on the performance of the Chandra LETGS can be found on the instruments and calibration page: http://cxc.harvard.edu/cal/Links/Letg/User/