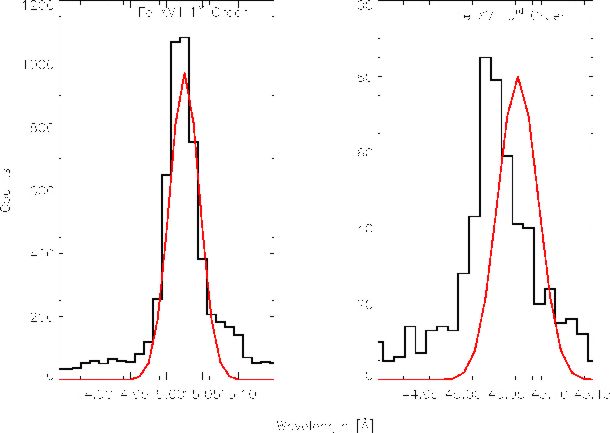
FIGURE 9: Spectral lines of the RS CVn star Capella obtained with HRC-S LETG observation. Note the detected and expected lines do not agree for the higher order line. Figure courtesy of Vinay Kashyap.
At the recent Chandra Calibration Workshop, the LETG team presented HRC-S/LETG data which show that positions of the positive and negative orders of spectral lines are not always symmetric on the detector. In addition, some of these lines do not appear to fall at their "proper" theoretical locations on the detector given the nominal LETG dispersion relation (independently verified with ACIS/LETG observations on-orbit). As an example of this phenomenon, the first and third positive orders of an Fe XVII line from the spectrum of the RS CVn star Capella are plotted in Figure 9 along with the predicted line profile. There is a clear offset between the observed and predicted position of the third order line. By analyzing many spectral lines from a compendium of sources, it is found that these offsets are not systematic, but vary in a complex manner across the detector. This variation across the detector is shown graphically in Figure 10. Typical magnitudes of these discrepancies are from 0.02Å to 0.05Å, with a maximum excursion of up to 0.1Å. These non-linearities are near the performance level of detectors of this type and may require pixel-by-pixel calibration. This is also discussed in the LETG article below.
FIGURE 9: Spectral lines of the RS CVn star Capella obtained with
HRC-S LETG observation. Note the detected and expected lines do not
agree for the higher order line. Figure courtesy of Vinay Kashyap.
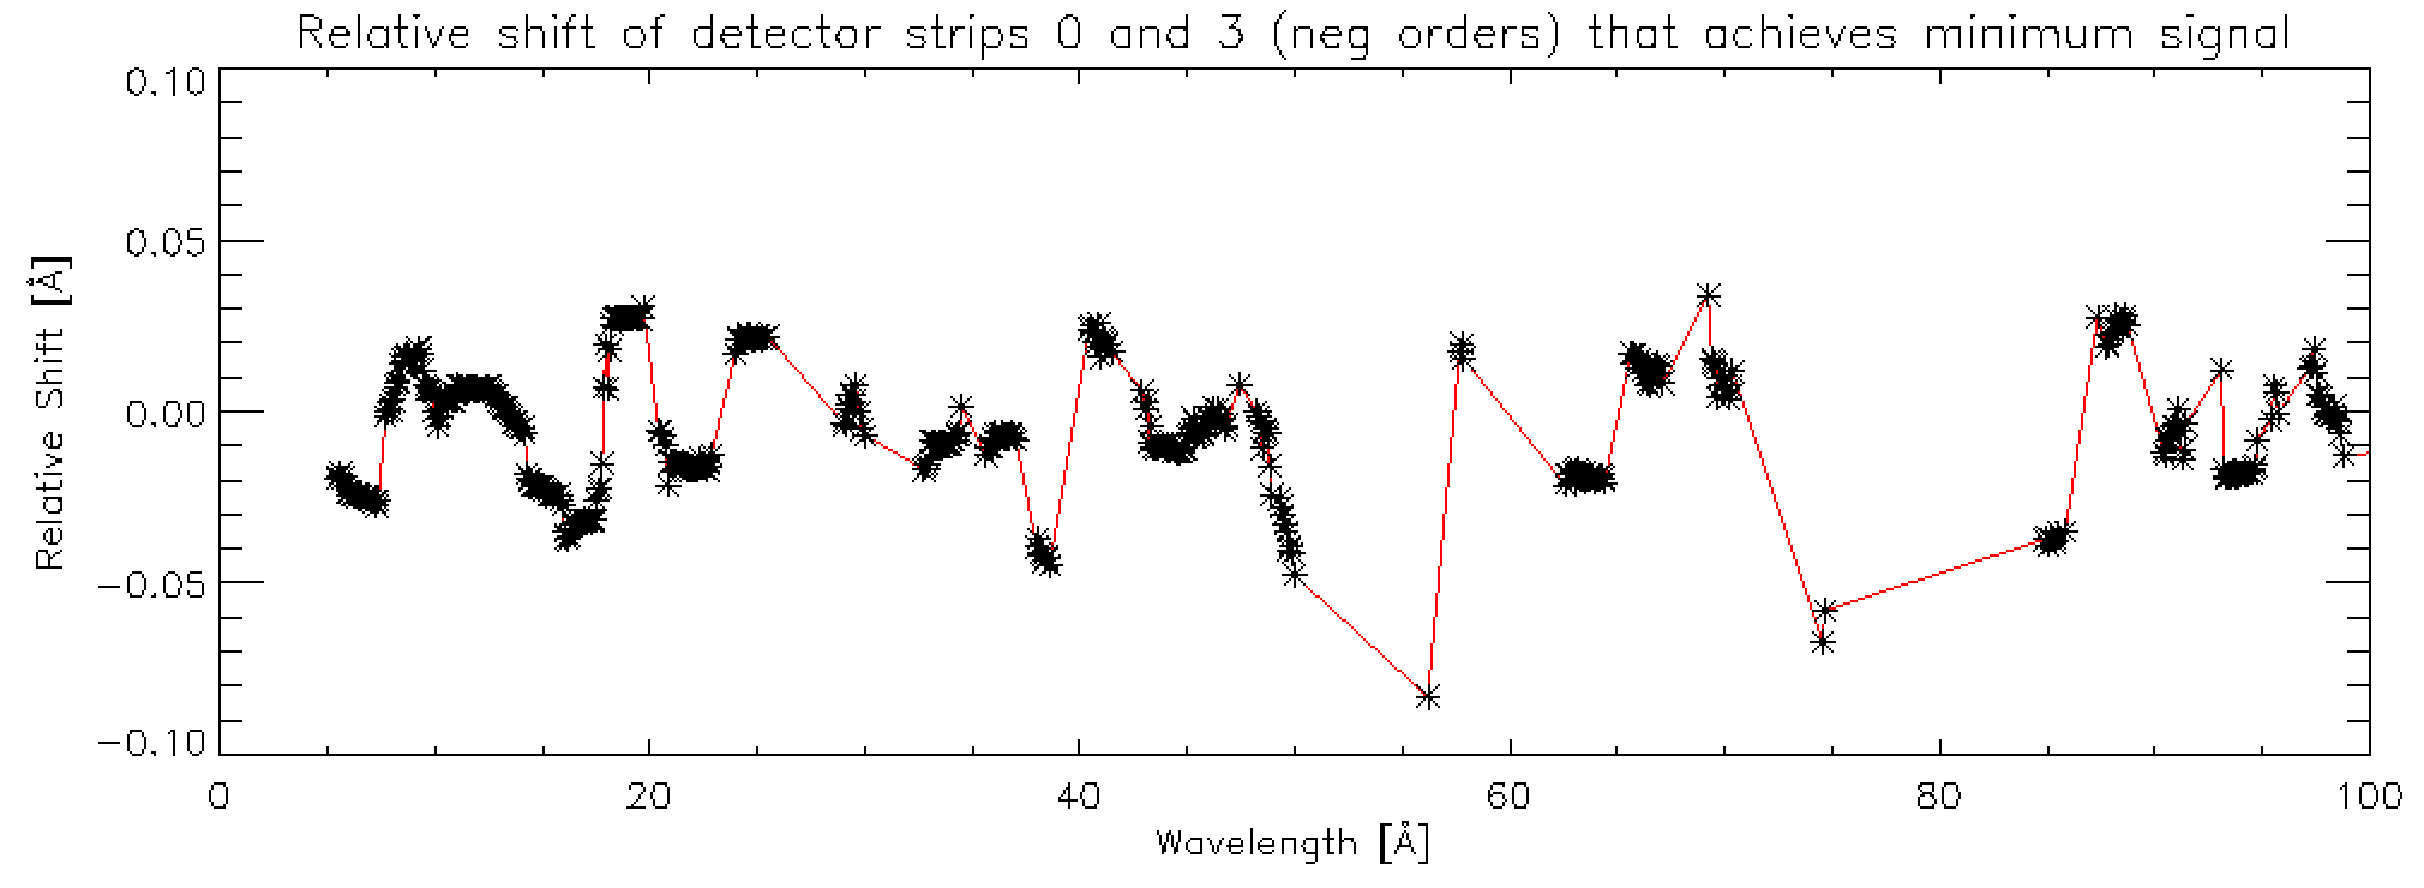
FIGURE 10: Discrepancy between positive and negative orders from a
compendium of observations with HRC-S LETG. Plot shows deviations in Å
.
Evidence suggests that these systematic uncertainties are due to small-scale spatial non-linearities in the HRC-S detector. We are investigating this issue in order to maximize the scientific gain. The HRC IPI team is presently examining ways to reduce or entirely eliminate these small position offsets by mapping out the HRC spatial non-linearities at the highest level of possible detail. Measurements of the small-scale spatial non-linearities will be made in the HRC laboratory with the HRC instrument Proof-of-Concept (POC) detector and a system of translation stages, position encoders and nickel etched pinhole masks. The results of this measurement campaign will be analyzed and the findings will be used to understand and model the non-linearities in order to reduce these position errors in the in-flight HRC detectors. We are also continuing to analyze in-flight data and to investigate whether additional in-flight observations can shed light on this issue.
In an independent investigation, the HRC IPI team is conducting a feasibility study on the use of the HRC anti-coincidence shield as a monitor of the Chandra radiation background. This function is currently being performed by the EPHIN, but the recent upward trend in the EPHIN temperature has raised the possibility that its performance may degrade with time. Apart from being a scientific instrument in its own right, the EPHIN serves the very practical function of monitoring the Chandra spacecraft radiation environment and aids mission operations by determining when to prepare the spacecraft and the scientific instruments for high radiation environments. Because of the steady rise in temperature of the EPHIN, an alternative method may eventually have to be developed to monitor the spacecraft radiation environment.
Fortunately, the HRC anti-coincidence shield may be able to fill the space environment monitoring role of the EPHIN. The HRC anti-coincidence shield consists of a box made of plastic scintillator and two photomultiplier tubes surrounding the HRC detectors. The primary purpose of this shield is to veto charged particle events that pass through the shield and are simultaneously detected by one of the HRC detectors. Preliminary results indicate that the anti-coincidence shield should be capable of monitoring the local radiation environment.
A plot of the quiescent EPHIN rate versus anti-coincidence shield rate is shown in Figure 11. It is apparent that the HRC shield rate correlates well to the EPHIN integral channel flux, at least over a limited range shown in the figure.
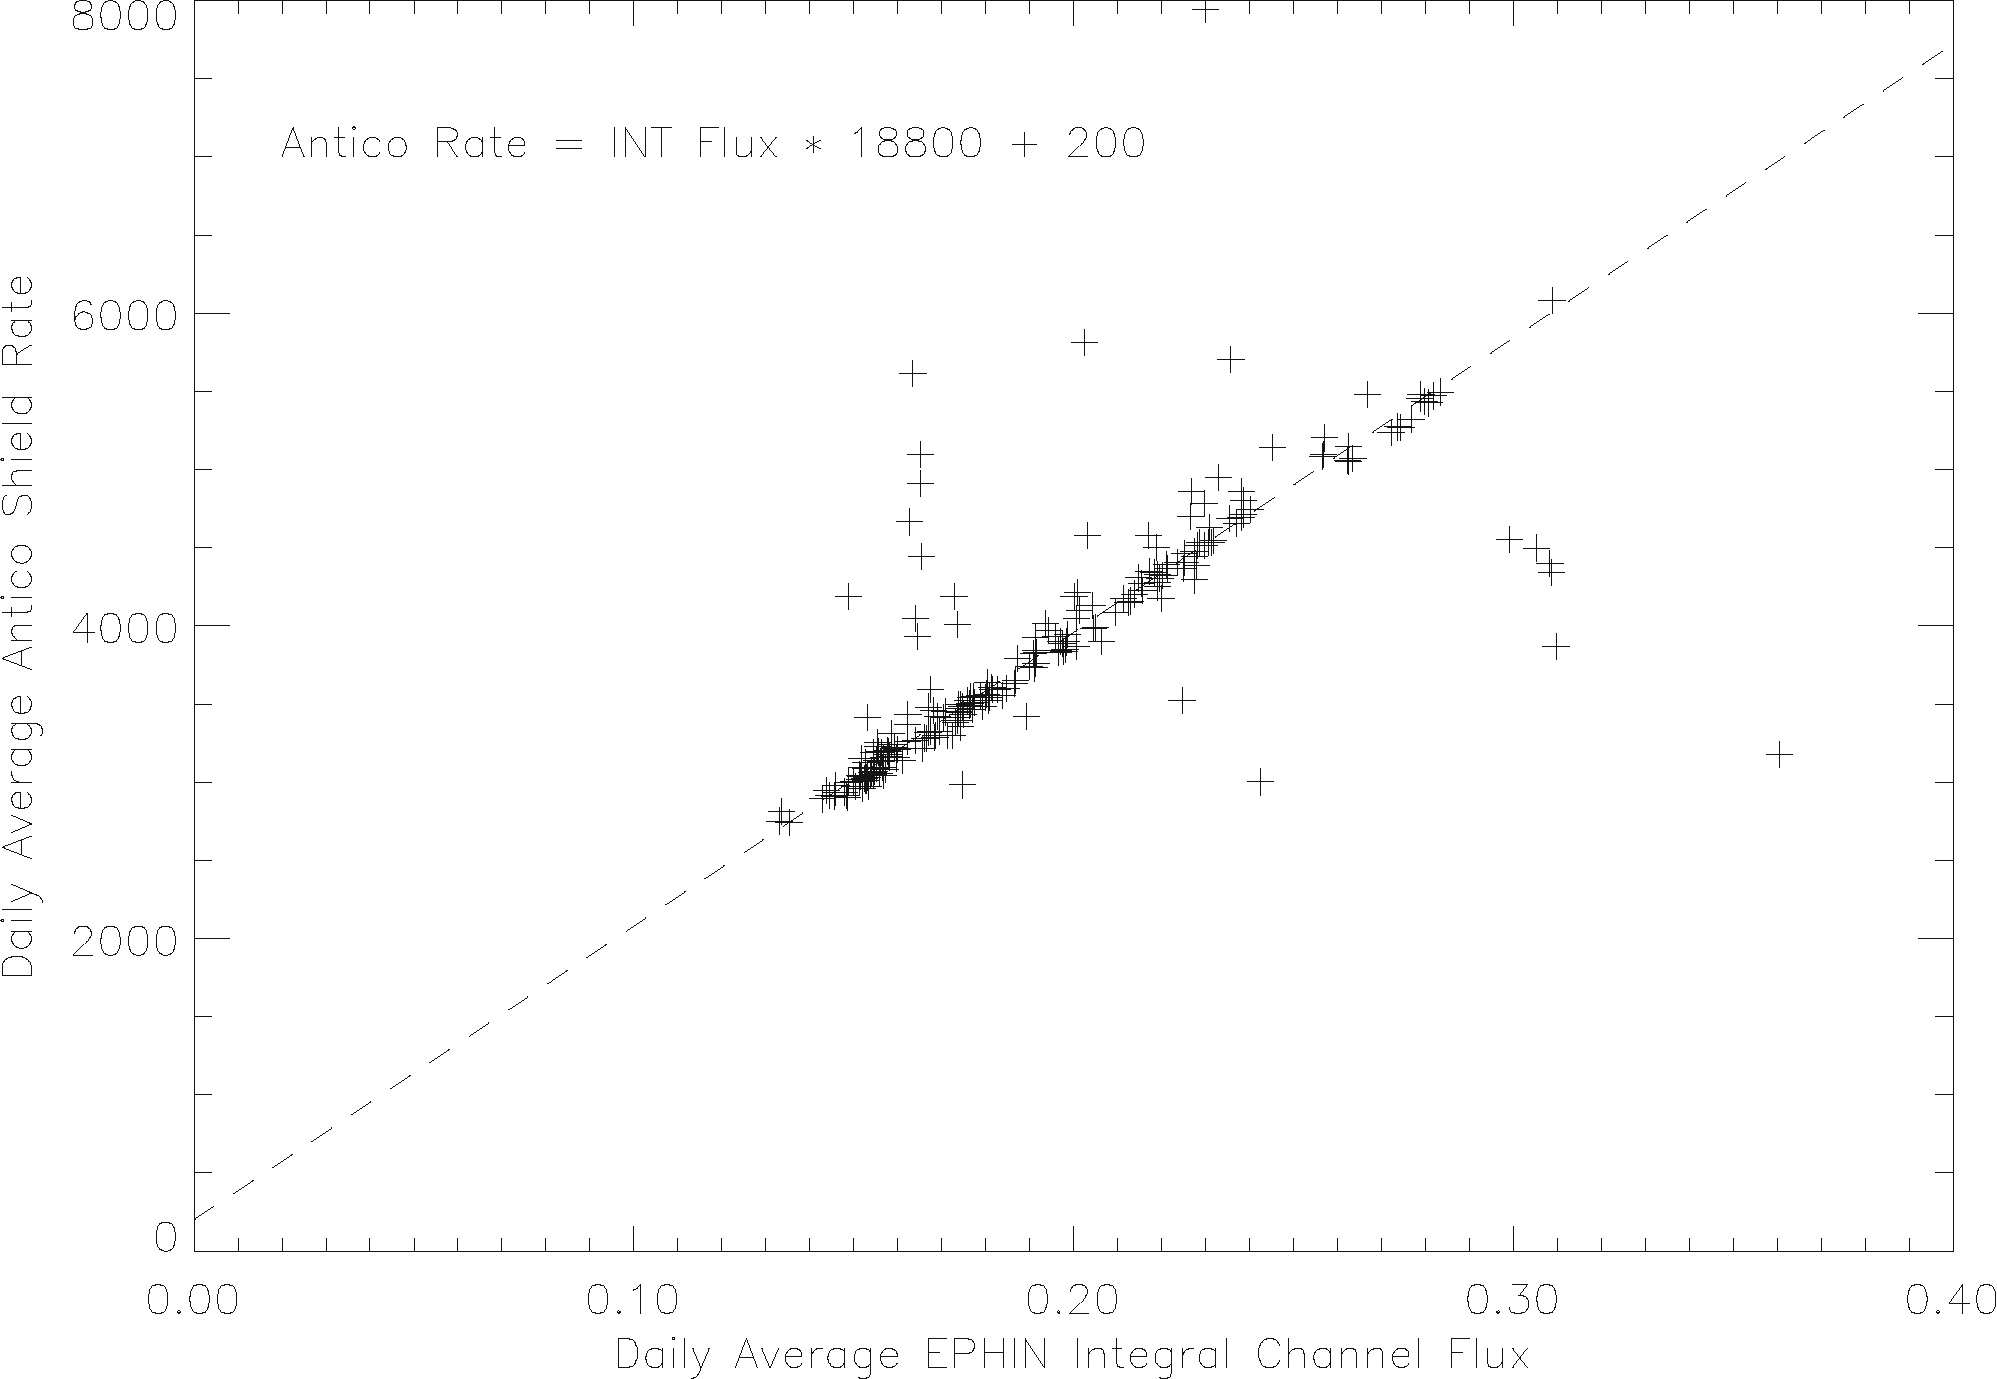
FIGURE 11: Correlation of quiescent EPHIN integral channel rate and
HRC anticoincidence rate. Courtesy of Michael Juda
HRC Science
Long Term Monitoring of M31
As part of the HRC GTO program, Mike Garcia and Benjamin Williams continue to observe M31 with the HRC-I as part of a multi-year survey. The larger FOV of the HRC (as compared to ACIS) allows them to cover the entire disk of M31 with only 5 pointings. Bright XRBs in M31 are visible in short HRC exposures, so the lower QE of the HRC (as compared to ACIS) is not a limitation in the study of variability of these sources.
Through this program, they have obtained 16 epochs of Chandra-HRC snapshot images covering a total baseline of ~2.5 years and containing a mean total exposure of 17 ks. They have measured the mean fluxes and long-term lightcurves for 172 objects detected in these data. One representative lightcurve is shown in Figure 12. They find that M31 contains a dynamic X-ray source population. Measurements show that at least 30% of the sources vary significantly on ~1 year timescales. Over a dozen new transient sources were found, the majority in the bulge and therefore likely containing black holes. A comparison of the number of these objects versus the persistent bulge sources (likely containing neutron stars) indicates the relative numbers of black holes versus neutron stars, modulo the duty cycle of the transients.
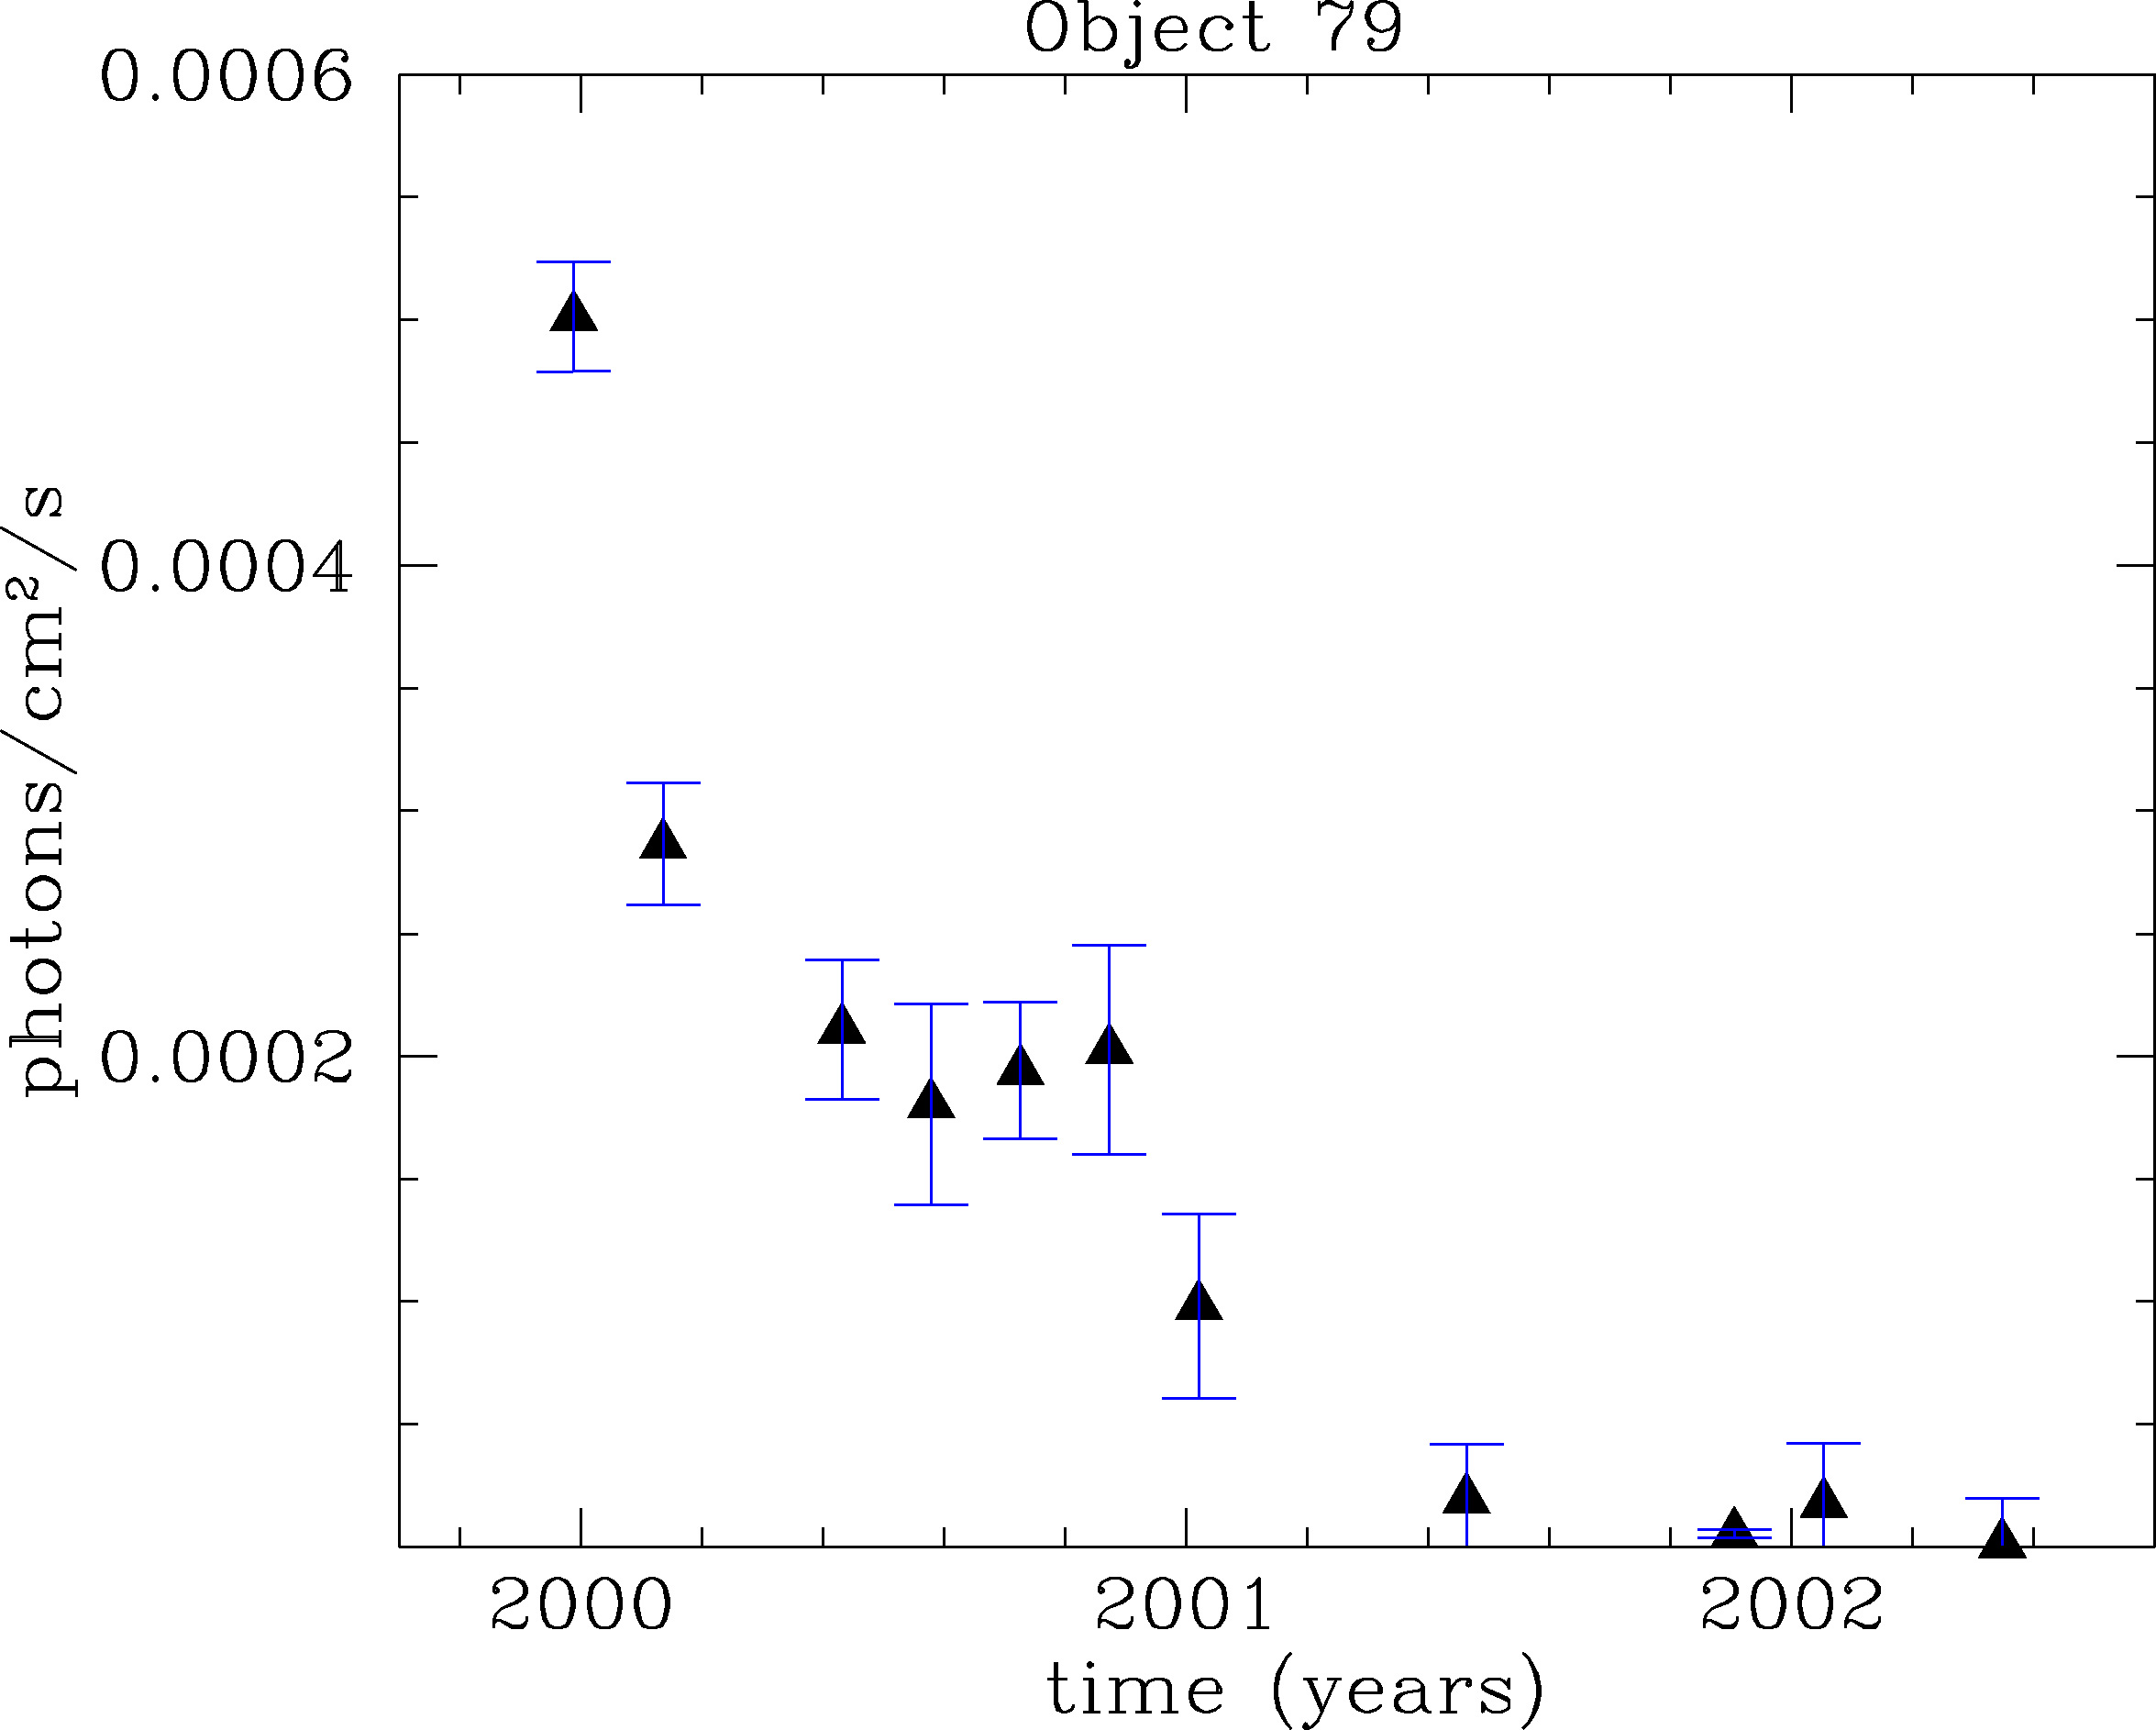
FIGURE 12: Time variability of one of the M31 x-ray sources.
They have also searched through published X-ray, optical and radio catalogs, as well as new optical data, searching for previous detections and counterparts for these X-ray sources. Via comparison to the Local Group Survey (Massey et al. 2001) data, they were able to find several new optical counterparts. Many of these have the colors of foreground stars, but several have colors/magnitudes typical of M31 upper main sequence and supergiants: 2 (B=21.46, V=20.45), 14 (B=21.14, V=21.23), and 171 (B=17.88, V=17.15). Typically, foreground stars in the M31 field have colors of B-V~0.5 to B-V~1.5. Object 2 has a color and magnitude appropriate for an M31 red giant. Object 14 is the color of an M31 upper main sequence star, and 171 has the color and magnitude of an M31 red supergiant. Follow-up spectra may provide positive identifications for these stars.
ULX Identification
In a separate study using the HRC, Kris Eriksen and Pat Slane have observed the enigmatic X-ray source 1E0953.8+6918, located in the M81 group dwarf irregular galaxy Holmberg IX (Ho IX). 1E0953.8+6918 is one of the nearest and most luminous members of the class of "Ultra-Luminous" X-ray sources (ULXs); objects whose X-ray luminosities (Lx > 1039 erg s-1, assuming isotropic emission) greatly exceed the Eddington luminosity for a neutron star. As such, the most luminous ULXs may either contain accreting "intermediate mass" (~100 solar mass) black holes, or are beamed and may be related to Galactic microquasars. Most ULXs are observed in galaxies that are vigorously forming stars and are thus thought to be associated with massive stars. 1E0953+69 is particularly interesting in that Ho IX has very little current star formation (UV observations show that Ho IX has no main sequence stars earlier than B0). While previous X-ray observations of 1E0953+69 had sufficient resolution to indicate that the source is roughly coincident with a bright optical emission line shell, a high resolution HRC observation, combined with images from the Vatican Advanced Technology Telescope (shown in Figure 13), clearly establish that the optical counterpart is a stellar association located near the center of the shell.
Preliminary analysis of MMT optical spectroscopy indicates that the shell was shock heated by a recent energetic event equivalent to 10-100 supernovae, providing insight into the possible origin of ULXs.
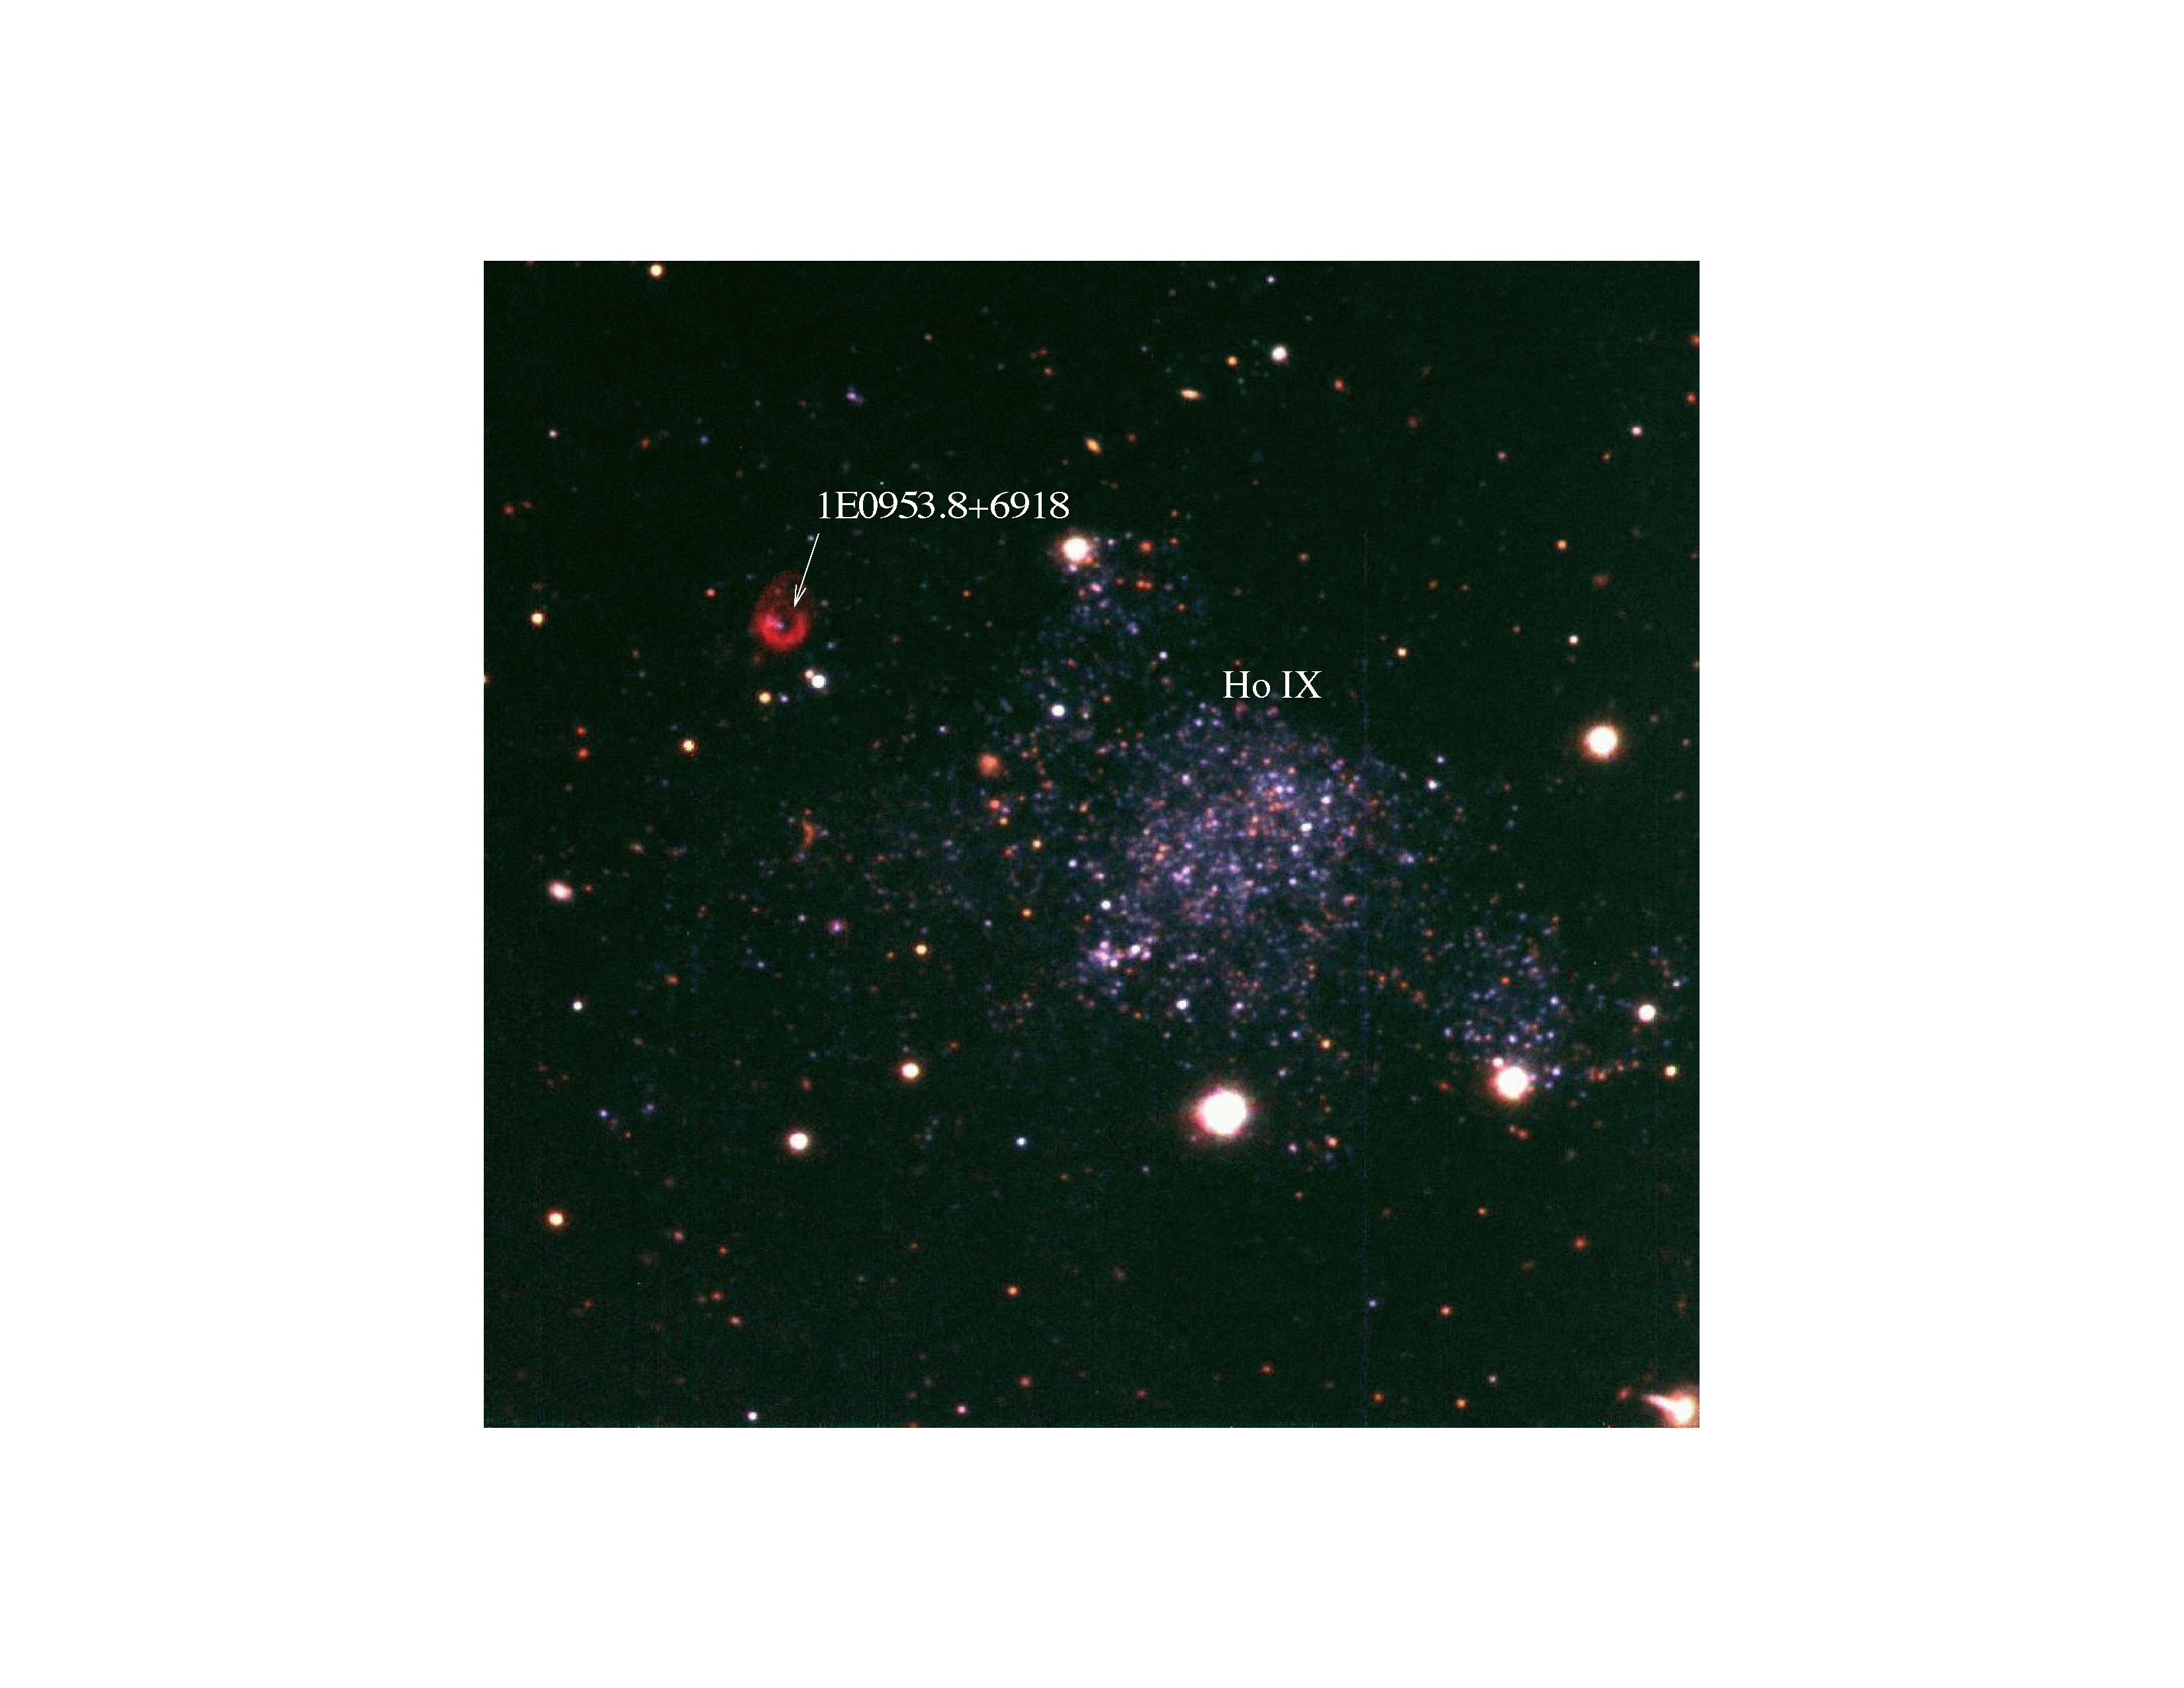
FIGURE 13: Vatican Advanced Technology B,V+[O III],R+Hα+[N II]
composite of Ho IX. The ULX is located inside the bright emission-line
shell in the northeast (upper-left) of the image. Figure courtesy of
Kris Eriksen.
Acknowledgements
Vinay Kashyap, Mike Garcia, Ben Williams, Michael Juda, Kris Eriksen, and Pat Slane have contributed to this article.
Almus Kenter and Ralph Kraft , for the HRC team