 |
For the purpose of using the HRC for astronomical investigations, several instrument performance parameters are of primary interest. These quantities are: the effective area of the HRC in conjunction with the HRMA; the point spread function (PSF) of the HRC in conjunction with the HRMA; count rate linearity; spatial variation of the response; geometrical non-linearity; background and background non-uniformity.
To fulfill the scientific goals of the HRC mission, a thorough calibration program was planned (see AXAF News, Issues nos. 3-5). This program was intended to calibrate the HRC/Chandra at various levels of integration from subassembly up through an end-to-end calibration encompassing the HRMA, the OTG's and the detectors.
The original subassembly plan included detailed testing and calibration of the UVIS (Ultraviolet/Ion Shields) characteristics, including uniformity, X-ray and UV transmission. The HRC resolution, spatial linearity, count rate linearity were also to be determined. These calibration data were then to be incorporated into empirical models of the HRC performance. Due to scheduling pressure to complete and deliver the final HRC, only a fraction of the original subassembly calibration was accomplished. During final assembly, some additional design modifications were also implemented to accommodate the incorporation of all the additional flight hardware; a decision was made to operate with the UVIS at ground potential as opposed to the original +100 volts with respect to the top MCP. Laboratory tests were performed with non-flight HRC detectors to examine the effects of this late design change and at that time none were observed. Upon delivery of the flight HRC to XRCF for end-to-end testing, several problems were discovered. First, a very high amplitude 91kHz ripple was observed from the high voltage power supplies. This ripple was present on the trigger signal for the HRC and necessitated operating the HRC at a much higher trigger threshold. This higher trigger threshold resulted in much lower effective HRC QE values, especially for the HRC-S detector. Second, a very low intensity (about 1% of the primary image) secondary ``bump'' in the PSF was observed in the HRC-I detector. Later it was determined that this secondary image was due to operating the UVIS at ground potential. Third, the MCPs showed a higher than expected gain causing some event pulses to be saturated.
Following the XRCF calibration, the HRC was returned to the SAO laboratory in Cambridge, MA. At SAO the gain saturation problem was fixed and a new filter network was installed to remove the 91kHz ripple and the HRC detectors were re-calibrated for absolute quantum efficiency and spatial uniformity.
The majority of the tests at the XRCF were measurements of the overall effective area (telescope plus detector) at numerous energies. With the presence of the HRMA, it was also possible to measure the effects of a converging beam on to the MCP pores in the same geometry as for flight (to be compared with laboratory tests using collimated beams) and the reflectivity of the HESF(High Energy Suppression Filter) mirrors at the same angles as in flight. Other tests involved measuring the count rate linearity of the detectors, the spatial linearity over large and small scales, and verifying the point response function of the total system on and off axis.
The availability of the transmission grating spectrometers at the XRCF also provided an opportunity for calibrating the performance of the HRC-S/LETGS (Low Energy Transmission Grating Spectrometer) and HRC-I/HETGS (High Energy Transmission Grating Spectrometer). They were mainly measurements of total effective area for the combined instruments, and measurements of the point spread function convolved with the grating response to obtain the energy resolution of the spectrometers. The primary analysis of these data was carried out by the Grating teams.
The effective area measurements are mainly useful for determining the HRC quantum efficiency as configured for the XRCF calibration. This derived quantum efficiency, in combination with flat field maps obtained after the XRCF calibration, and effective area measurements made with the LETG can be used to determine the LETG efficiency. The HRC quantum efficiency as obtained can also be used for ``bootstrapping'' the final quantum efficiency model for the HRC.
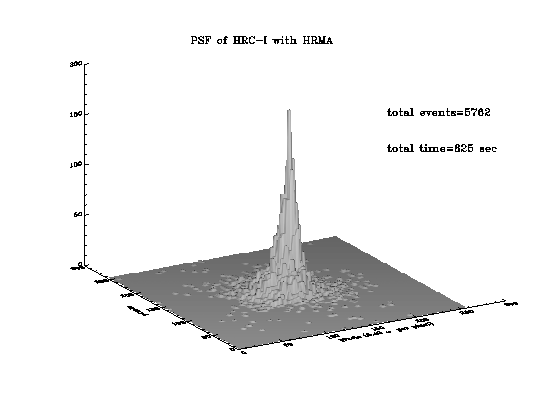
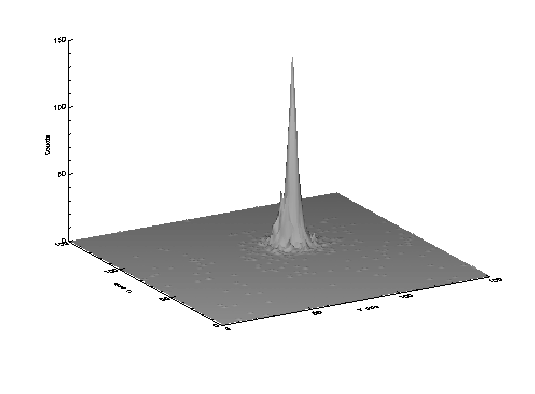
Figures 3 and 4 show surface plots of the HRC-I/HRMA and HRC-S/HRMA point spread functions measured at 277 eV. The half-power radii of the point spread functions for the HRC-I/HRMA and HRC-S/HRMA are 0.45 and 0.51 arc seconds, respectively at this energy. These radii are uncorrected for finite source distance and gravity distortion effects on the HRMA image quality.
 |
 |
The spatial scale of HRC-I was found to be 6.429  m per pixel;
the detector is linear to within 1 to 2 pixels over spatial scales
ranging from millimeters to the full detector dimensions. The spatial
scale of HRC-S was found to be 6.429
 ![]() m per pixel;
the detector is linear to
within 1 to 2 pixels over spatial scales ranging from millimeters to
the full detector dimensions. These results are completely consistent
with predictions based upon the geometry of the as-built position
readout systems.
m per pixel;
the detector is linear to
within 1 to 2 pixels over spatial scales ranging from millimeters to
the full detector dimensions. These results are completely consistent
with predictions based upon the geometry of the as-built position
readout systems.
THE HRC-I was found to linear with incident flux (point source) for count rates up to 15 ct s-1 and the HRC-S was found to linear with incident flux (point source) for count rates at least up to 20 ct s-1 .
The internal background rates of HRC-I and HRC-S are both 0.14 ct s-1.
After the XRCF testing was completed the HRC was returned to SAO so that the 91 KHz and high gain problems could be addressed. It was also more convenient to make flat field measurements at the SAO facilities where a high speed data tap could be used to permit data rates 10 times higher than available at the XRCF.
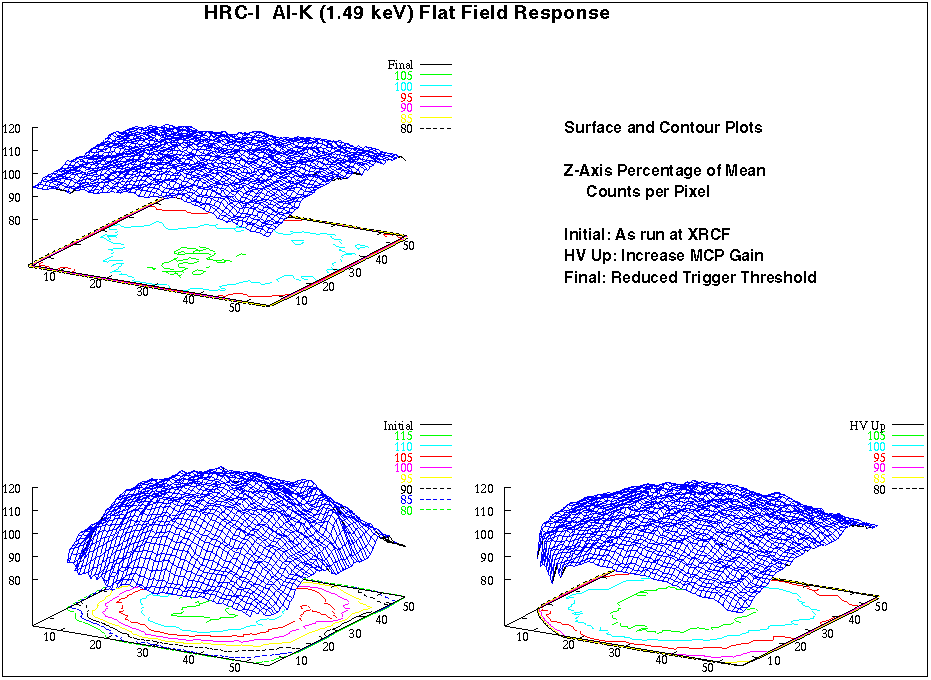
After the hardware fixes were implemented, a series of flat field tests were carried out. Figure 5 and Figure 6 show flat field surface plots for HRC-I and HRC-S for three configurations - as-run at XRCF, HV raised to increase MCP gain, and finally reduced trigger threshold and HV raised. We have succeeded in significantly improving the flat field response of the detectors.
 |
 |
The quantum efficiency of both detectors was measured at the following energies: 183 eV, 277 eV, 525 eV, 851 eV, 1487 eV, 2980 eV, 4511 eV, and 6404 eV. The data was used to construct semi-empirical models of the quantum efficiencies of the two detectors (Figures 7 and 8). There are two major deficiencies in the QE models that we will address in the future. First, the jumps across the edges are too large. The current models may be off as much as a factor of two around the edges. Second, the low energy QE has been considerably overestimated, perhaps also by a factor of 2. The smooth portion of the interpolated curve is probably more accurate, we estimate within 10% or so. Both of these numbers will be improved when our synchrotron measurements are incorporated. The synchrotron data provide a direct measurement of the jumps across the edges and the shape of the curve between the edges. Any systematic uncertainties in the synchrotron data are smaller than the uncertainties that exist in the current QE model. In addition, we also have an extensive on-orbit calibration program planned that will allow us to test and further refine our QE models.
 |
Calibration data products, the HRC Calibration Report, and sub-assembly calibration reports can be found at the HRC web site:
http://hea-www.harvard.edu/HRC/calib/calib.html
The CXC maintains a web site of HRC Calibration Interface Products at:
http://asc.harvard.edu/cal/CIP/Hrc/hrc_cip.html
- M. Zombeck and H. Donnelly