| Science Run Stop: | 2023:03:15:11:41 |
| Science Run Start: | 2023:03:17:05:09 |
| Interruption: | 103.0ks |
| Triggered by: | manual |
Go to:
ACE Plot (E38/E175, P47/P112/P310/P761/P1060)
HRC Plot (HRC Shield Rate)
ACIS Plot (ACIS Count Rate)
GOES-R Plot (P1/P2/P5/HRC Prox)
XMM Plot (LE and HES)
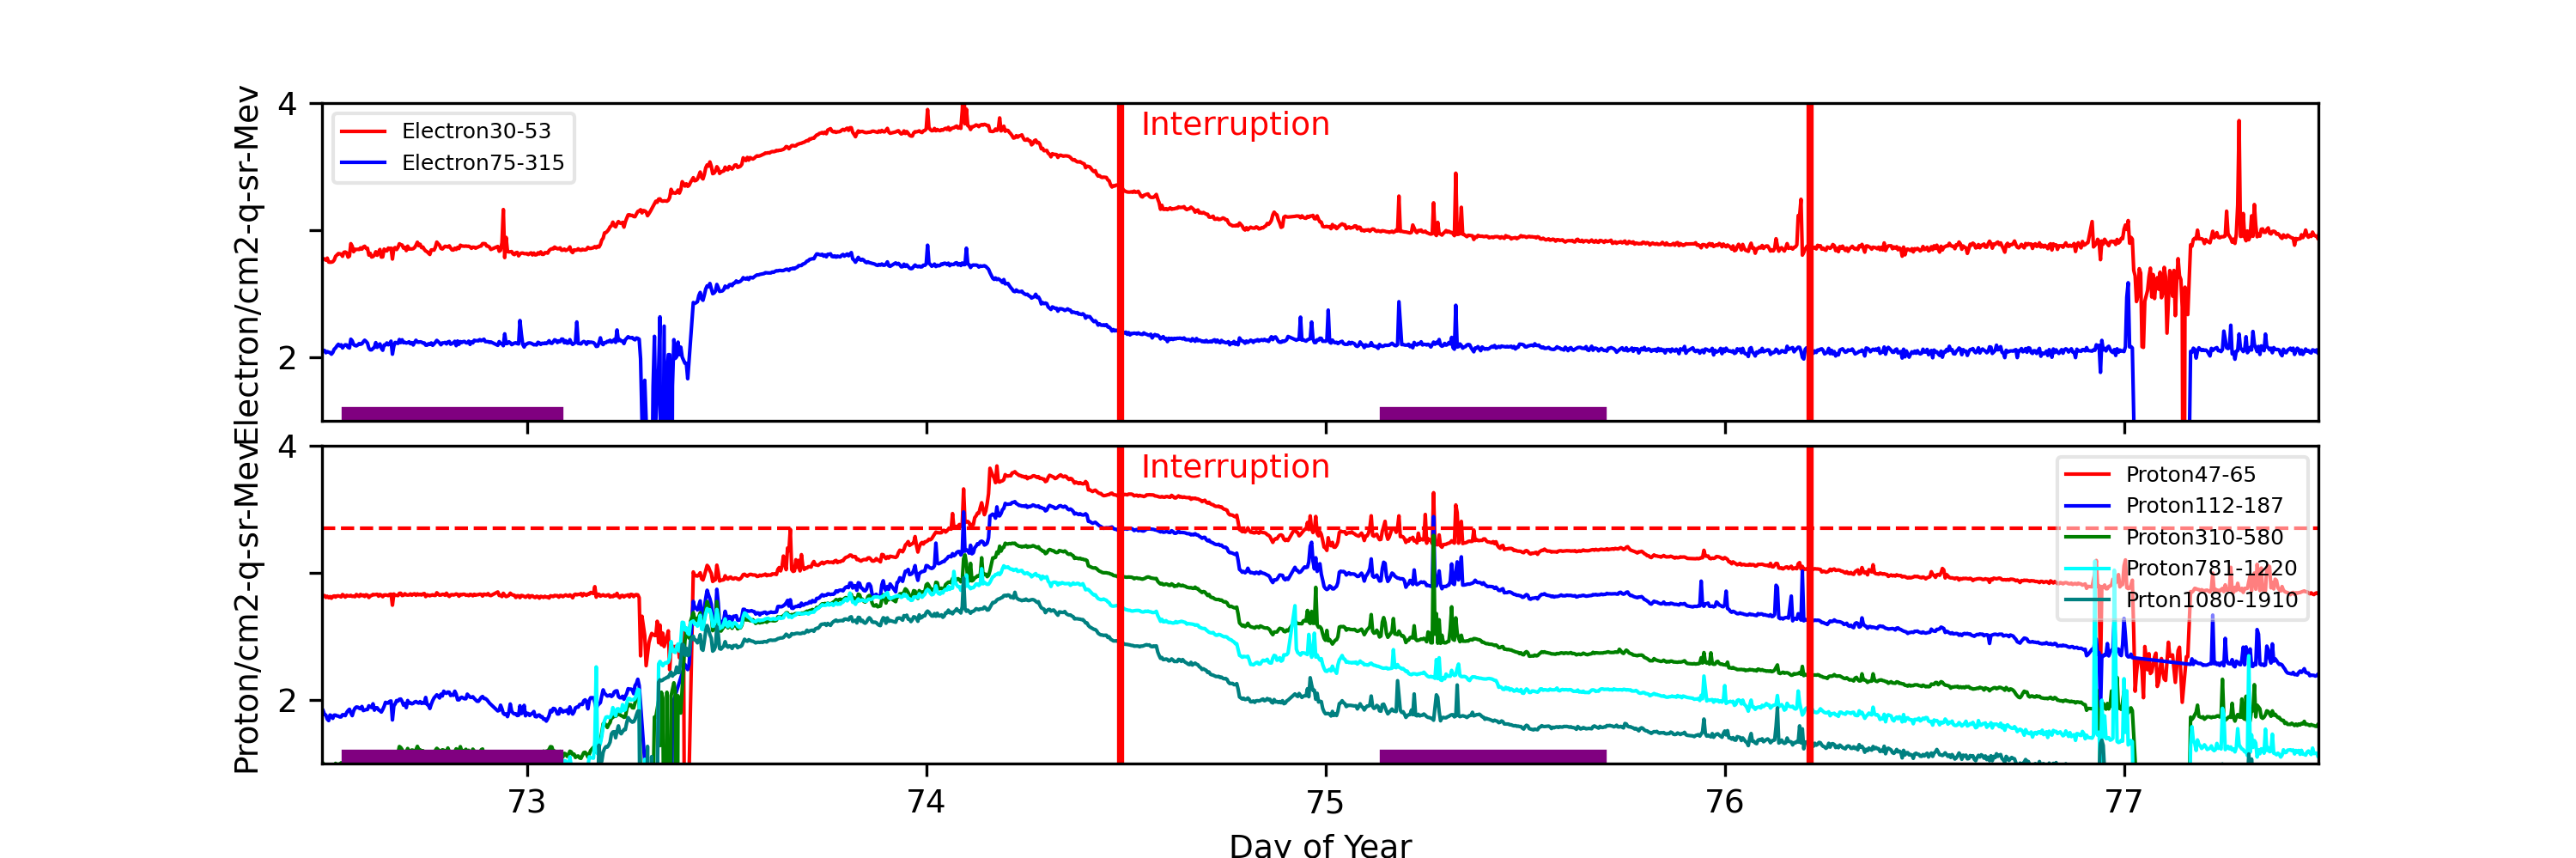
ACE radiation data are plotted around periods when science runs were interrupted. Plots start exactly 2 days before the interruption started. The top panel shows differential fluxes of electrons 38-53 and 175-315 (particles/cm2-s-ster-MeV), the middle panel shows differential fluxes of protons 47-65, 112-187, and 310-580 (particles/cm2-s-ster-MeV).
Data Period  (doy): 72.4868 - 77.4868
Interruption (doy): 74.4868 - 76.2146

			Avg			 Max		Time		Min		Time		Value at Interruption Started
-----------------------------------------------------------------------------------------------
e38	 		5.426e+04+/-8.213e+06	2.440e+06	74.094 	4.460e-05	77.149 	5.030e+04
e175	 		1.743e+03+/-2.941e+06	2.070e+06	77.917 	1.300e-05	73.361 	2.620e+02
p47	 		3.150e+04+/-4.392e+06	4.850e+05	74.177 	5.580e-03	73.396 	1.670e+05
p112	 		9.156e+03+/-1.398e+06	1.330e+05	74.222 	4.470e-05	73.358 	4.870e+04
p310	 		1.972e+03+/-3.065e+05	3.920e+04	75.271 	4.870e-05	73.299 	8.970e+03
p761	 		1.022e+03+/-2.081e+05	1.070e+05	78.931 	4.890e-05	73.288 	2.980e+03
p1060	 		4.209e+02+/-1.446e+05	9.420e+04	77.986 	6.670e-05	73.292 	8.350e+02
e38/e175 		4.163e+38+/-8.383e+41	5.749e+41	73.312 	2.047e-01	78.931 	1.920e+02
p47/p1060 		1.773e+44+/-4.801e+47	3.394e+47	78.271 	1.096e-05	73.396 	2.000e+02
p112/p1060 		1.740e+32+/-3.959e+35	2.778e+35	77.972 	2.545e-03	77.087 	5.832e+01
p310/p1060 		4.880e+31+/-1.314e+35	9.292e+34	77.969 	3.817e-03	77.059 	1.074e+01
p761/p1060 		4.036e+33+/-1.039e+37	7.329e+36	78.267 	1.118e-05	73.306 	3.569e+00

Steepest Rise
------------
	Time		Slope(in log per hr)
----------------------------------------
e38 	74.0833		4621087.7493
e175 	77.9062		4765844.9923
p47 	74.1597		884154.3078
p112 	74.1806		287810.6470
p310 	75.2604		88348.6587
p761 	78.9201		246365.9139
p1060 	77.9757		216894.1036
Two vertical red lines indicate the start and the end of the interruption. Purple hatched areas indicate that the satellite is in the radiation belt. The horizontal dashed line indicates P3 trigger level. If P3 level is higher than this level more than 2 hours, SCS 107 may be manually triggered.
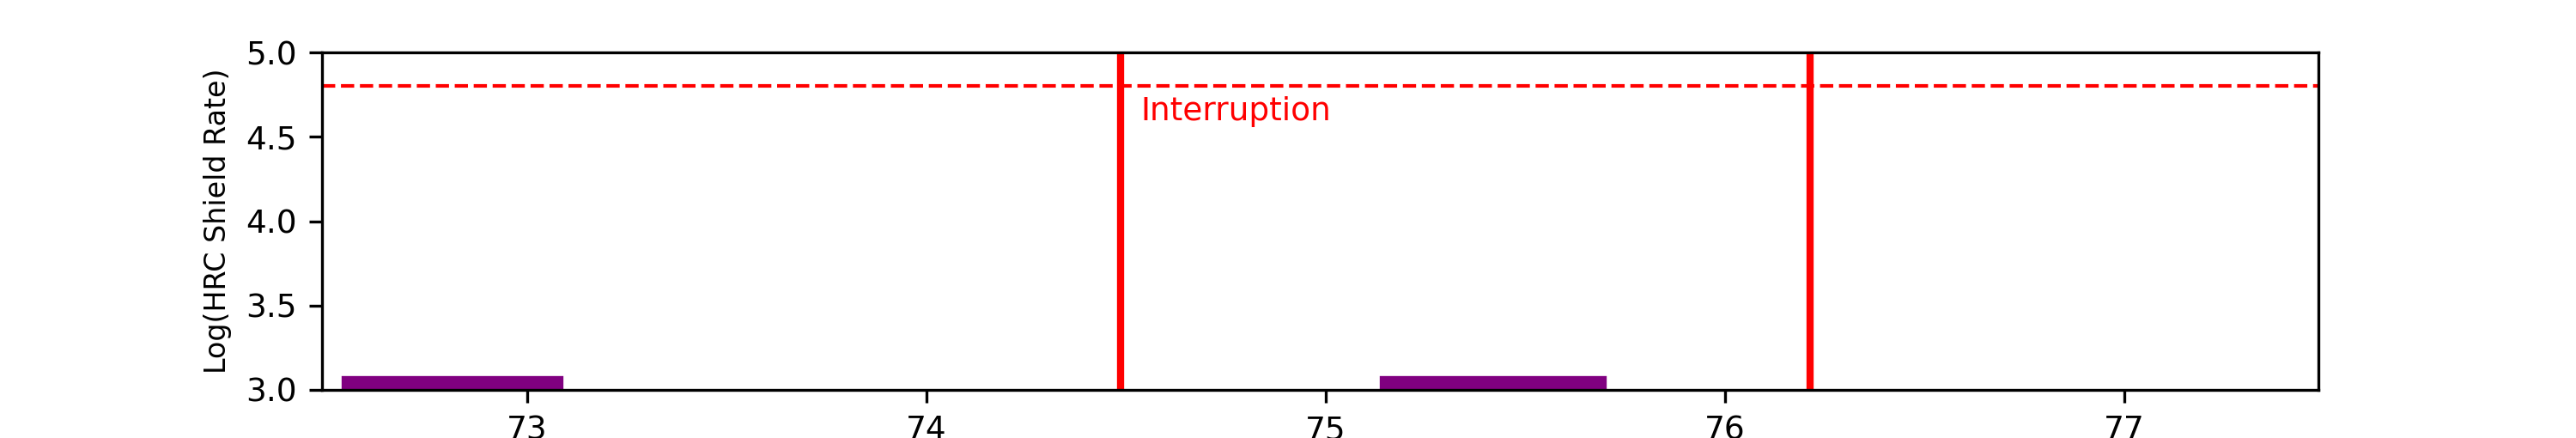
		Avg			Max		Time		Min		Time		Value at Interruption Started
-----------------------------------------------------------------------------------------------
hrc 		0.000e+00+/-0.000e+00	0.000e+00	0.000 	1.000e+10	0.000 	0.000e+00
Two vertical red lines indicate the start and the end of the interruption. Purple hatched areas indicate that the satellite is in the radiation belt. The red horizontal dashedline indicates SCS 107 limits. If the HRC shield rate/256 goes above 248, automatic SCS 107 is triggered.
The follwoing plots are copied from ACIS Threshold Corssings Page. For more details, please refer to Using ACIS to detect and report high radiation conditions


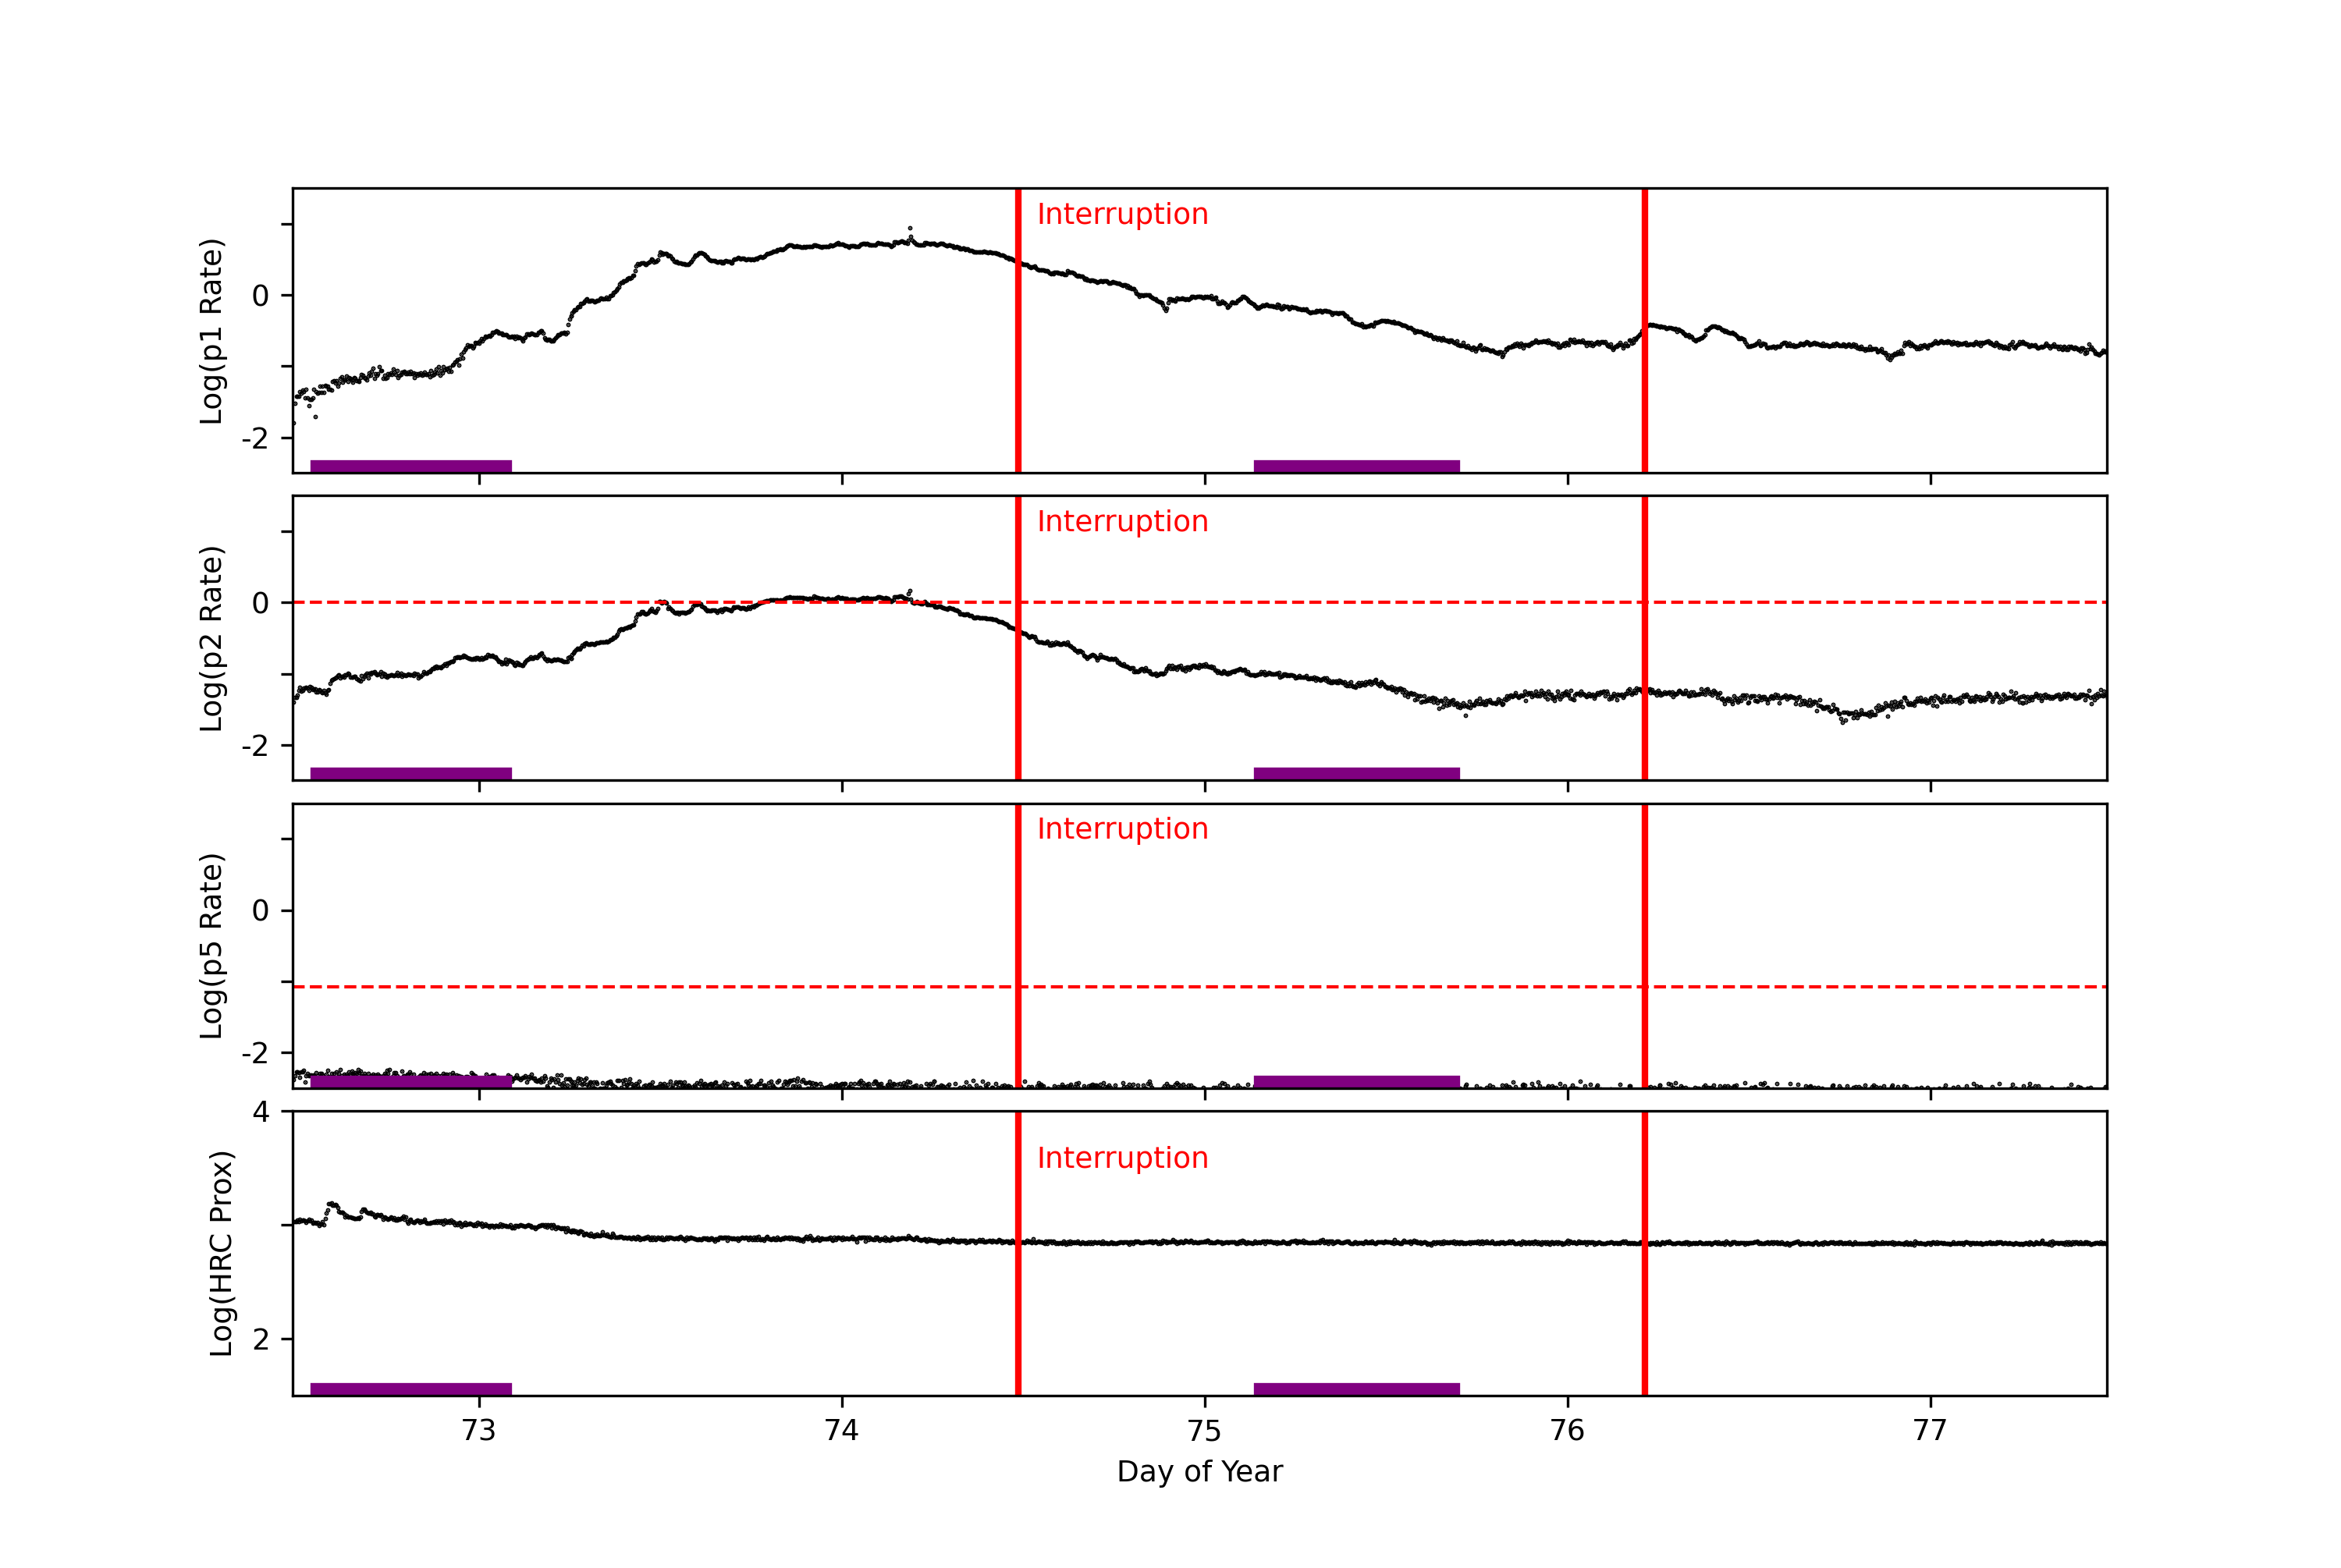
GOES-R data are taken from NOAA site (https://services.swpc.noaa.gov/json/goes/primary/integral-protons-1-day.json).
| P1 | 1.0 - 3.0 MeV protons (Counts/cm2 sec sr MeV) Uncorrected |
| P2 | 3.4 - 11.0 MeV protons (Counts/cm2 sec sr MeV) Uncorrected |
| P5 | 40.0 - 98.0 MeV protons (Counts/cm2 sec sr MeV) Uncorrected |
| HRC Prox | 6000 * (11.64-38.1MeV) + 270000 * (40.3-73.4MeV) 100000 * (83.7-242.0MeV) |
			avg			max		Time		min		Time		Value at Interruption Started
-----------------------------------------------------------------------------------------------
p1		3.101e+02 +/- 7.329e+02		7.606e+03	74.188		2.614e-02	72.490		8.542e+02
p2		1.443e+01 +/- 3.470e+01		2.214e+02	74.188		2.142e-02	77.677		1.588e+01
p5		1.034e-03 +/- 4.775e-04		3.376e-03	72.618		1.654e-04	75.274		1.246e-03
hrc prox	3.101e+02 +/- 7.329e+02		7.606e+03	74.188		2.614e-02	72.490		4.920e+03
Two vertical red lines indicate the start and the end of the interruption. Purple hatched areas indicate that the satellite is in the radiation belt. The red horizontal dashed lines indicate SCS 107 limits. If GOES P2 or P5 levels go above these levels, SCS 107 may be manually triggered.
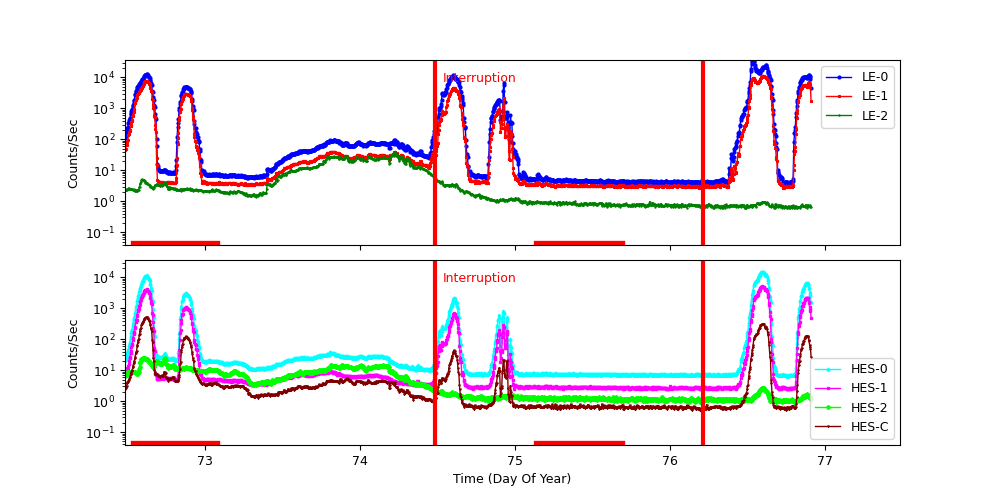
	Avg			 Max			Time		Min			Time		Value at Interruption Started
-----------------------------------------------------------------------------------------------
LE-0:  1.373e+03 +/- 4.094e+03	3.341e+04	     76.534		3.844e+00	     76.739	      2.816e+02
LE-1:  6.366e+02 +/- 1.836e+03	1.119e+04	     76.609		2.723e+00	     76.739	      4.542e+01
LE-2:  5.361e+00 +/- 8.029e+00	4.039e+01	     74.227		5.950e-01	     76.727	      5.503e+00
HES-0: 5.973e+02 +/- 2.116e+03	1.525e+04	     76.599		6.658e+00	     76.755	      2.039e+01
HES-1: 1.986e+02 +/- 7.101e+02	5.095e+03	     76.599		2.392e+00	     76.018	      5.932e+00
HES-2: 5.006e+00 +/- 5.107e+00	2.563e+01	     72.608		9.180e-01	     76.197	      2.173e+00
HES-C: 1.792e+01 +/- 6.264e+01	5.268e+02	     72.626		5.290e-01	     76.197	      1.182e+00
Two vertical red lines indicate the start and the end of the interruption. Red hatched areas indicate that the satellite is in the radiation belt.