We have tended Event Histogram mode in order to characterize the ACIS response. Two distinctive data are tended. One is data where ACIS is exposed to an external source, and the other is data where ACIS is seeing a background.
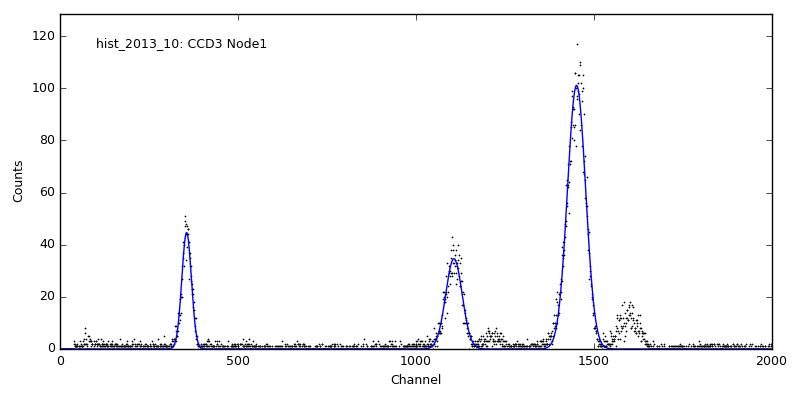
When HRC-S is located at the focal point (sim position:+250.1 mm: -100800 - -98400 motor steps), ACIS is exposed to the external source. When this happens, ACIS observes Al K alpha, Mn K alpha, and Ti K alpha lines. We collect these histogram mode data for each month, combine them, and fit a Gaussian profile to each peak, and find out a peak position, a peak width, and a count rate. The peak portion is recoded in ADU (bin position), the peak width is FWHM and in ADU, the count rate is counts/sec (each histogram file typically contains 1650 frames or 5,348 sec). One example fitting is shown on right.
There are also two different data sets in this histogram mode. One was obtained from CCD row positions 21-221, and the other are the row positions 801-1001. Since charges travel more in the latter, the peaks are more spread compared to the former cases.
When HRC-I is located at the focal point (sim position:+127.0 mm: -51700 - -49300 motor steps), ACIS is seeing a background. Since there are not enough counts per observation, and there are not many HRC-I observations, we did not create trend plots, but we created a composite background plot for each CCD, Node, and CCD row. The bin size for the background is 40 ADU so that there are 100 bins in the plot, and count rate is counts/second.
The following table contains:
Reference:
http://asc.harvard.edu/cal/Acis/Cal_prods/bkgrnd/current/background.html
Using C handra Level 0 Event Histogram Files to Characterize the High-Energy Particle Background (PS file)
Biller, B., Plucinsky, P., Edgar, R. 01/22/02
Please select Data:
| CCD | Peak Position | Peak Width | Peak Counts |
|---|---|---|---|
| CCD 1 | 21-221 801-1001 |
21-221 801-1001 |
21-221 801-1001 |
| CCD 2 | 21-221 801-1001 |
21-221 801-1001 |
21-221 801-1001 |
| CCD 3 | 21-221 801-1001 |
21-221 801-1001 |
21-221 801-1001 |
| CCD 6 | 21-221 801-1001 |
21-221 801-1001 |
21-221 801-1001 |
| CCD 7 | 21-221 801-1001 |
21-221 801-1001 |
21-221 801-1001 |
If you have any questions about this page, contact swolk@cfa.harvard.edu.
Last updated: Wed Apr 3 02:06:27 2024