| CCD0 | CCD1 | CCD2 | CCD3 | CCD4 | CCD5 | CCD6 | CCD7 | CCD8 | CCD9 | |
|---|---|---|---|---|---|---|---|---|---|---|
| Previously Unknown Bad Pixels | ||||||||||
| Current Warm Pixels | (143,700) (692,141) | (802,665) (910,239) | (178,149) (526,66) (726,537) | (21,95) (680,391) | (335,412) | |||||
| Flickering Warm Pixels | (370,70) | (665,25) | (811,637) (669,458) (318,53) | (263,317) (341,427) (258,797) (367,511) (357,303) (369,376) (161,206) | (1000,214) | (182,474) (881,53) (197,241) (139,109) | ||||
| Current Hot Pixels | ||||||||||
| Flickering Hot Pixels | ||||||||||
| Warm column candidates | 512 1022 510 | 512 1022 | ||||||||
| Flickering Warm column candidates |
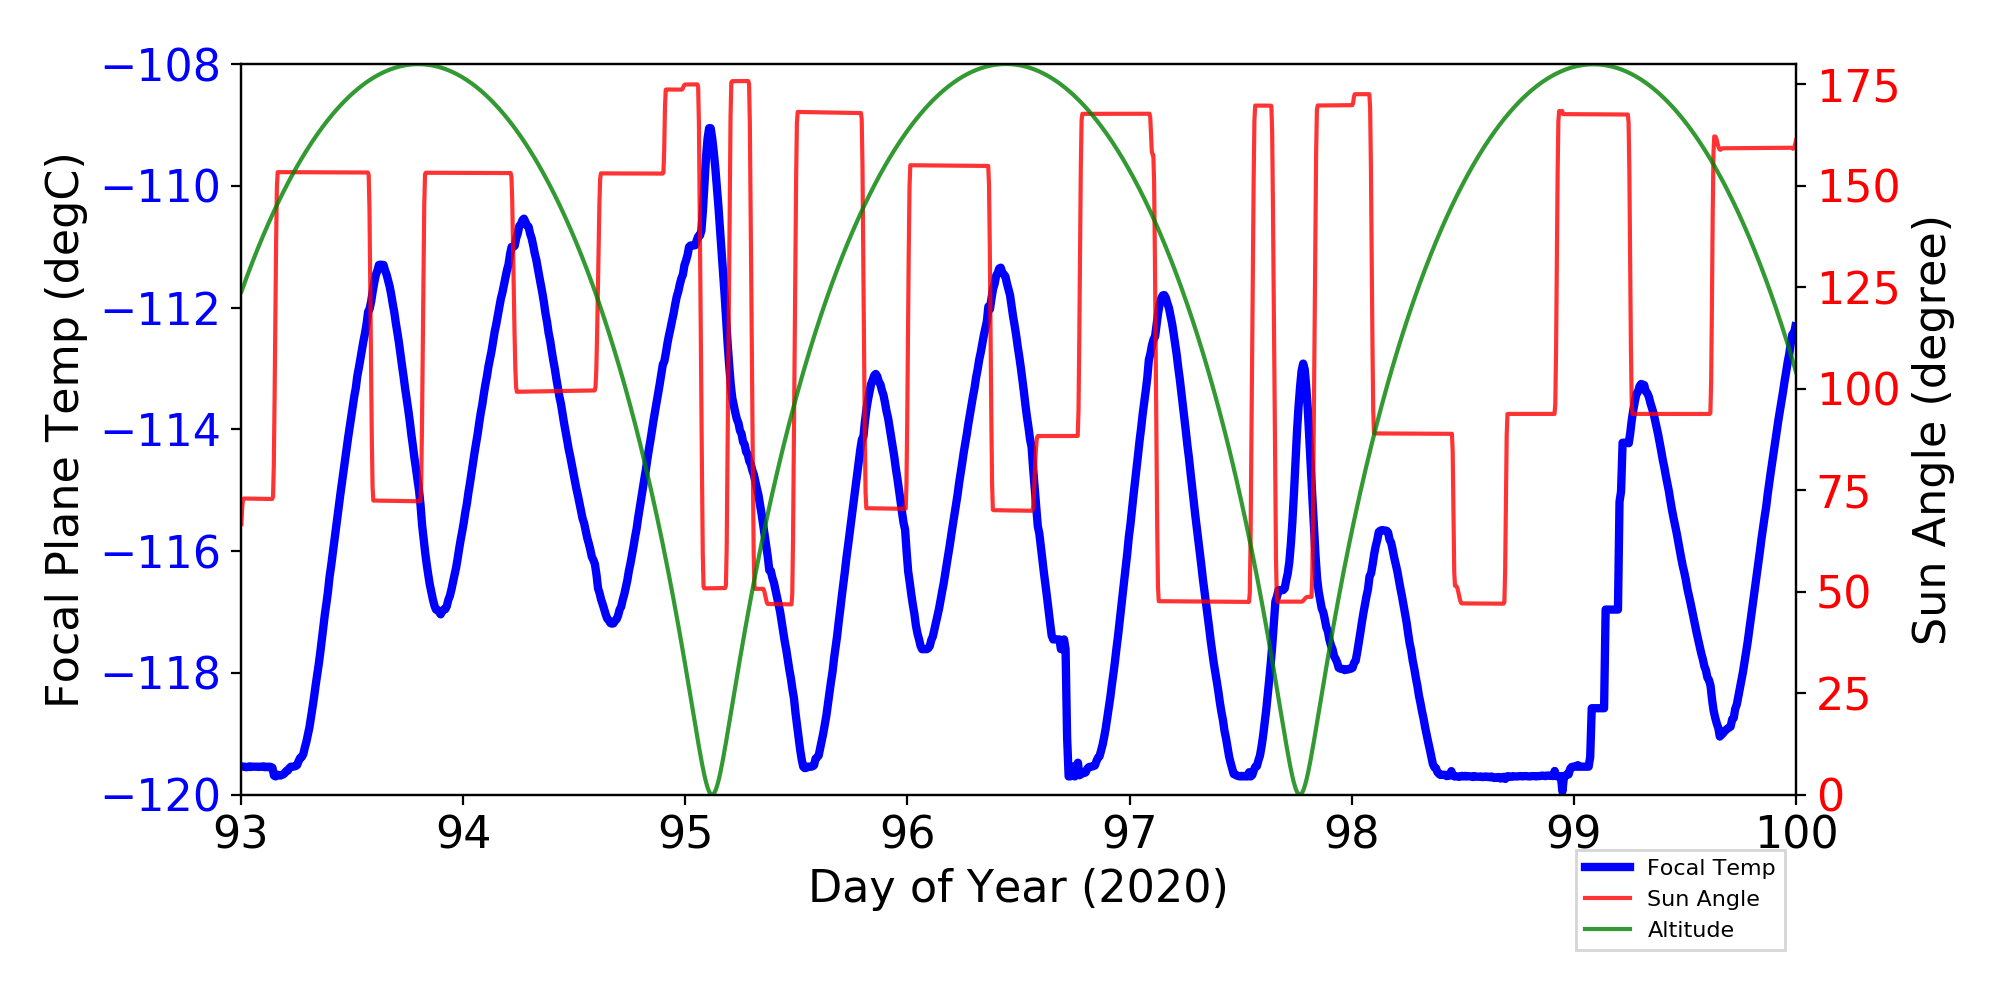
ACIS Focal Plane Temperature
For this period, 10 peaks are observed.
| Day (DOY) | Temp (C) | Width (Days) | |
|---|---|---|---|
| 093.64 | -111.30 | 0.72 | |
| 094.28 | -110.59 | 0.77 | |
| 095.12 | -109.22 | 0.87 | |
| 095.86 | -113.13 | 0.53 | |
| 096.43 | -111.43 | 0.59 | |
| 097.16 | -111.84 | 0.70 | |
| 097.79 | -113.02 | 0.41 | |
| 098.14 | -115.66 | 0.43 | |
| 099.31 | -113.26 | 0.63 | |
| 100.40 | -107.02 | 0.83 |
Weekly focal plane temperature with sun angle, earth angle, and altitude overplotted. Sun angle is the solar array angle, that is the angle between the sun and the optical axis (+X axis). The earth angle is the angle between earth and the ACIS radiator (+Z axis). Altitude varies from 34 kkm to 128 kkm.
SIM Movements
8 TSC moves this period
| weekly average time/step | 0.00130 s |
|---|---|
| mission average time/step | 0.00136 s |
Telemetry
New violations or new extrema are shown in blue cells.
| MSID | 04/03/20 | 04/04/20 | 04/05/20 | 04/06/20 | 04/07/20 | 04/08/20 | 04/09/20 | yellow limits (lower) upper | red limits (lower) upper | Units | Description |
| TEP_PSU2 | (264.06) | (264.06) | (283.15) 343.15 |
(264.15) 393.15 |
K | PSU-2 TEMP | |||||
| TCM_PA1 | (257.36) | (257.76) | (258.96) | (259.69) | (258.96) | (269.15) 348.15 |
(260.15) 413.15 |
K | RF POWER AMP-1 EXT BPL TEMP | ||
| ELBI | 67.42 | (20.0) 60.0 |
(13.0) 66.0 |
AMP | LOAD BUS CURRENT (HIGH RANGE) | ||||||
| OBACONEAVG | 304.73 | 303.64 | 305.11 | 304.69 | 301.58 | (282.5) 300.0 |
(281.8) 301.0 |
K | OBA CONE AVG TEMP | ||
| HRMACAV | 295.53 | 295.60 | (293.4) 294.8 |
(292.8) 295.5 |
TEMP | HRMA CAVITY AVG TEMP | |||||
| TSCTSF3 | (268.06) | (268.79) | (268.79) | (278.15) 359.15 |
(269.15) 483.15 |
K | SC-TS FITTING -3 TEMP | ||||
| TCM_TX1 | (266.61) | (266.97) | (266.97) | (267.33) | (266.97) | (268.06) | (266.97) | (283.15) 348.15 |
(269.15) 404.15 |
K | TRANSPONDER-1 EXT BPL TEMP |
| CTXBPWR | (0.00) | (0.00) | (0.00) | (0.00) | (0.00) | (0.00) | (0.00) | (36.12) 37.0 |
(36.0) 38.0 |
DBM | TRANSMITTER B OUTPUT POWER |
| S2HVLV | (83.00) | (126.0) 128.0 |
(125.0) 129.0 |
(2S2HVLV) | Shield PMT 2 HV Monitor | ||||||
| TCM_PA2 | (258.96) | (259.32) | (259.69) | (260.05) | (269.15) 348.15 |
(260.15) 413.15 |
K | RF POWER AMP-2 EXT BPL TEMP | |||
| OBAAVG | 301.21 | 301.47 | 301.10 | (282.5) 300.0 |
(281.4) 301.0 |
K | OBA/TFTE TEMP | ||||
| SPINATM | (-34.50) | (-34.50) | (-12.0) 35.0 |
(-15.0) 40.0 |
C | Spect Det Temperature |
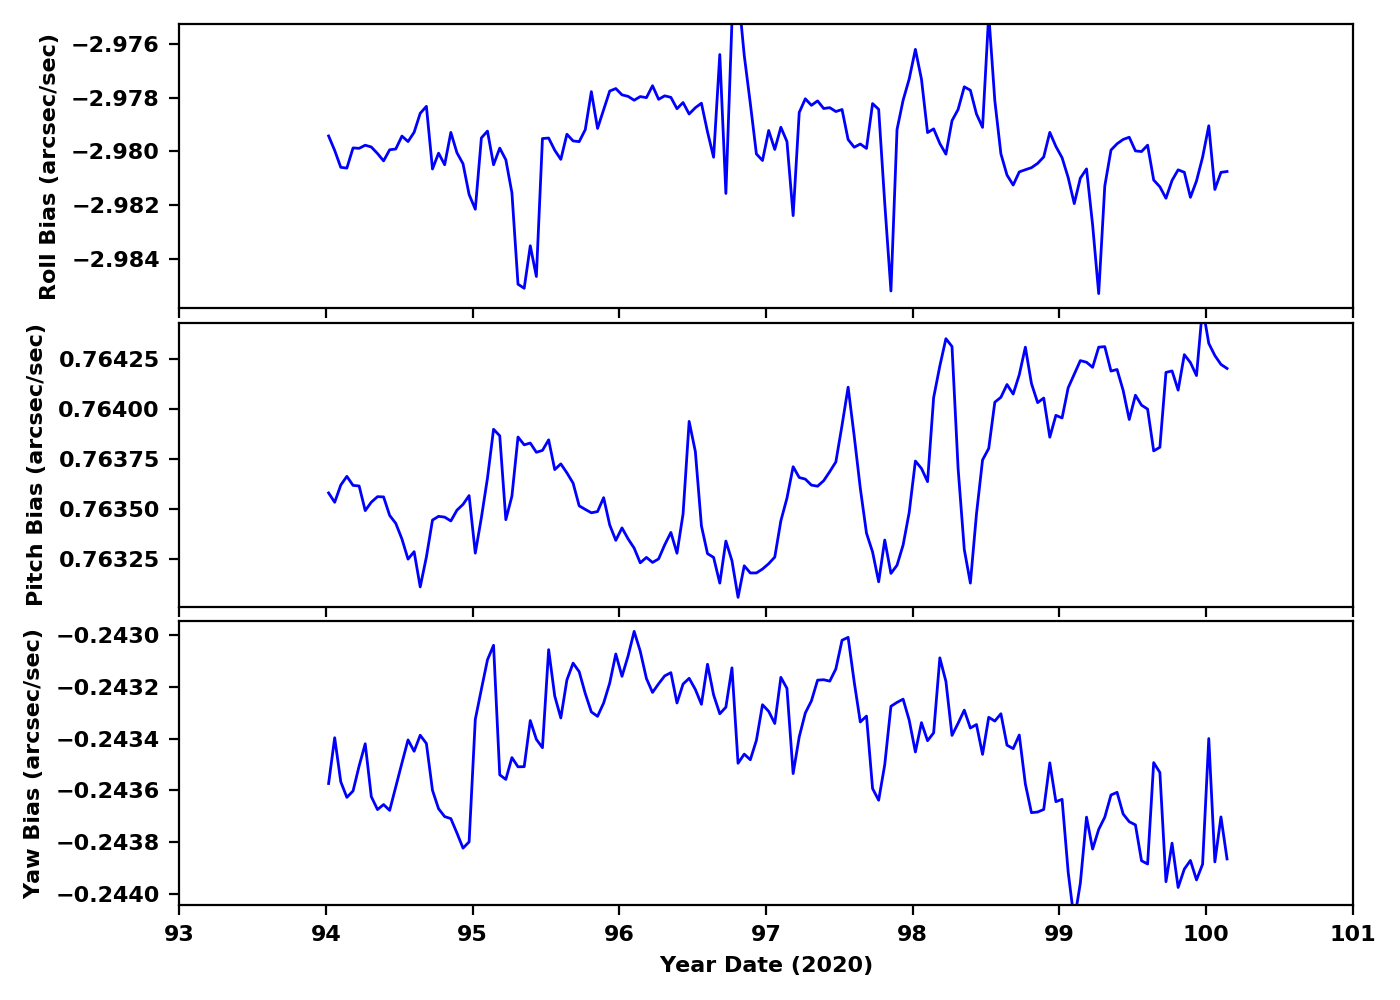
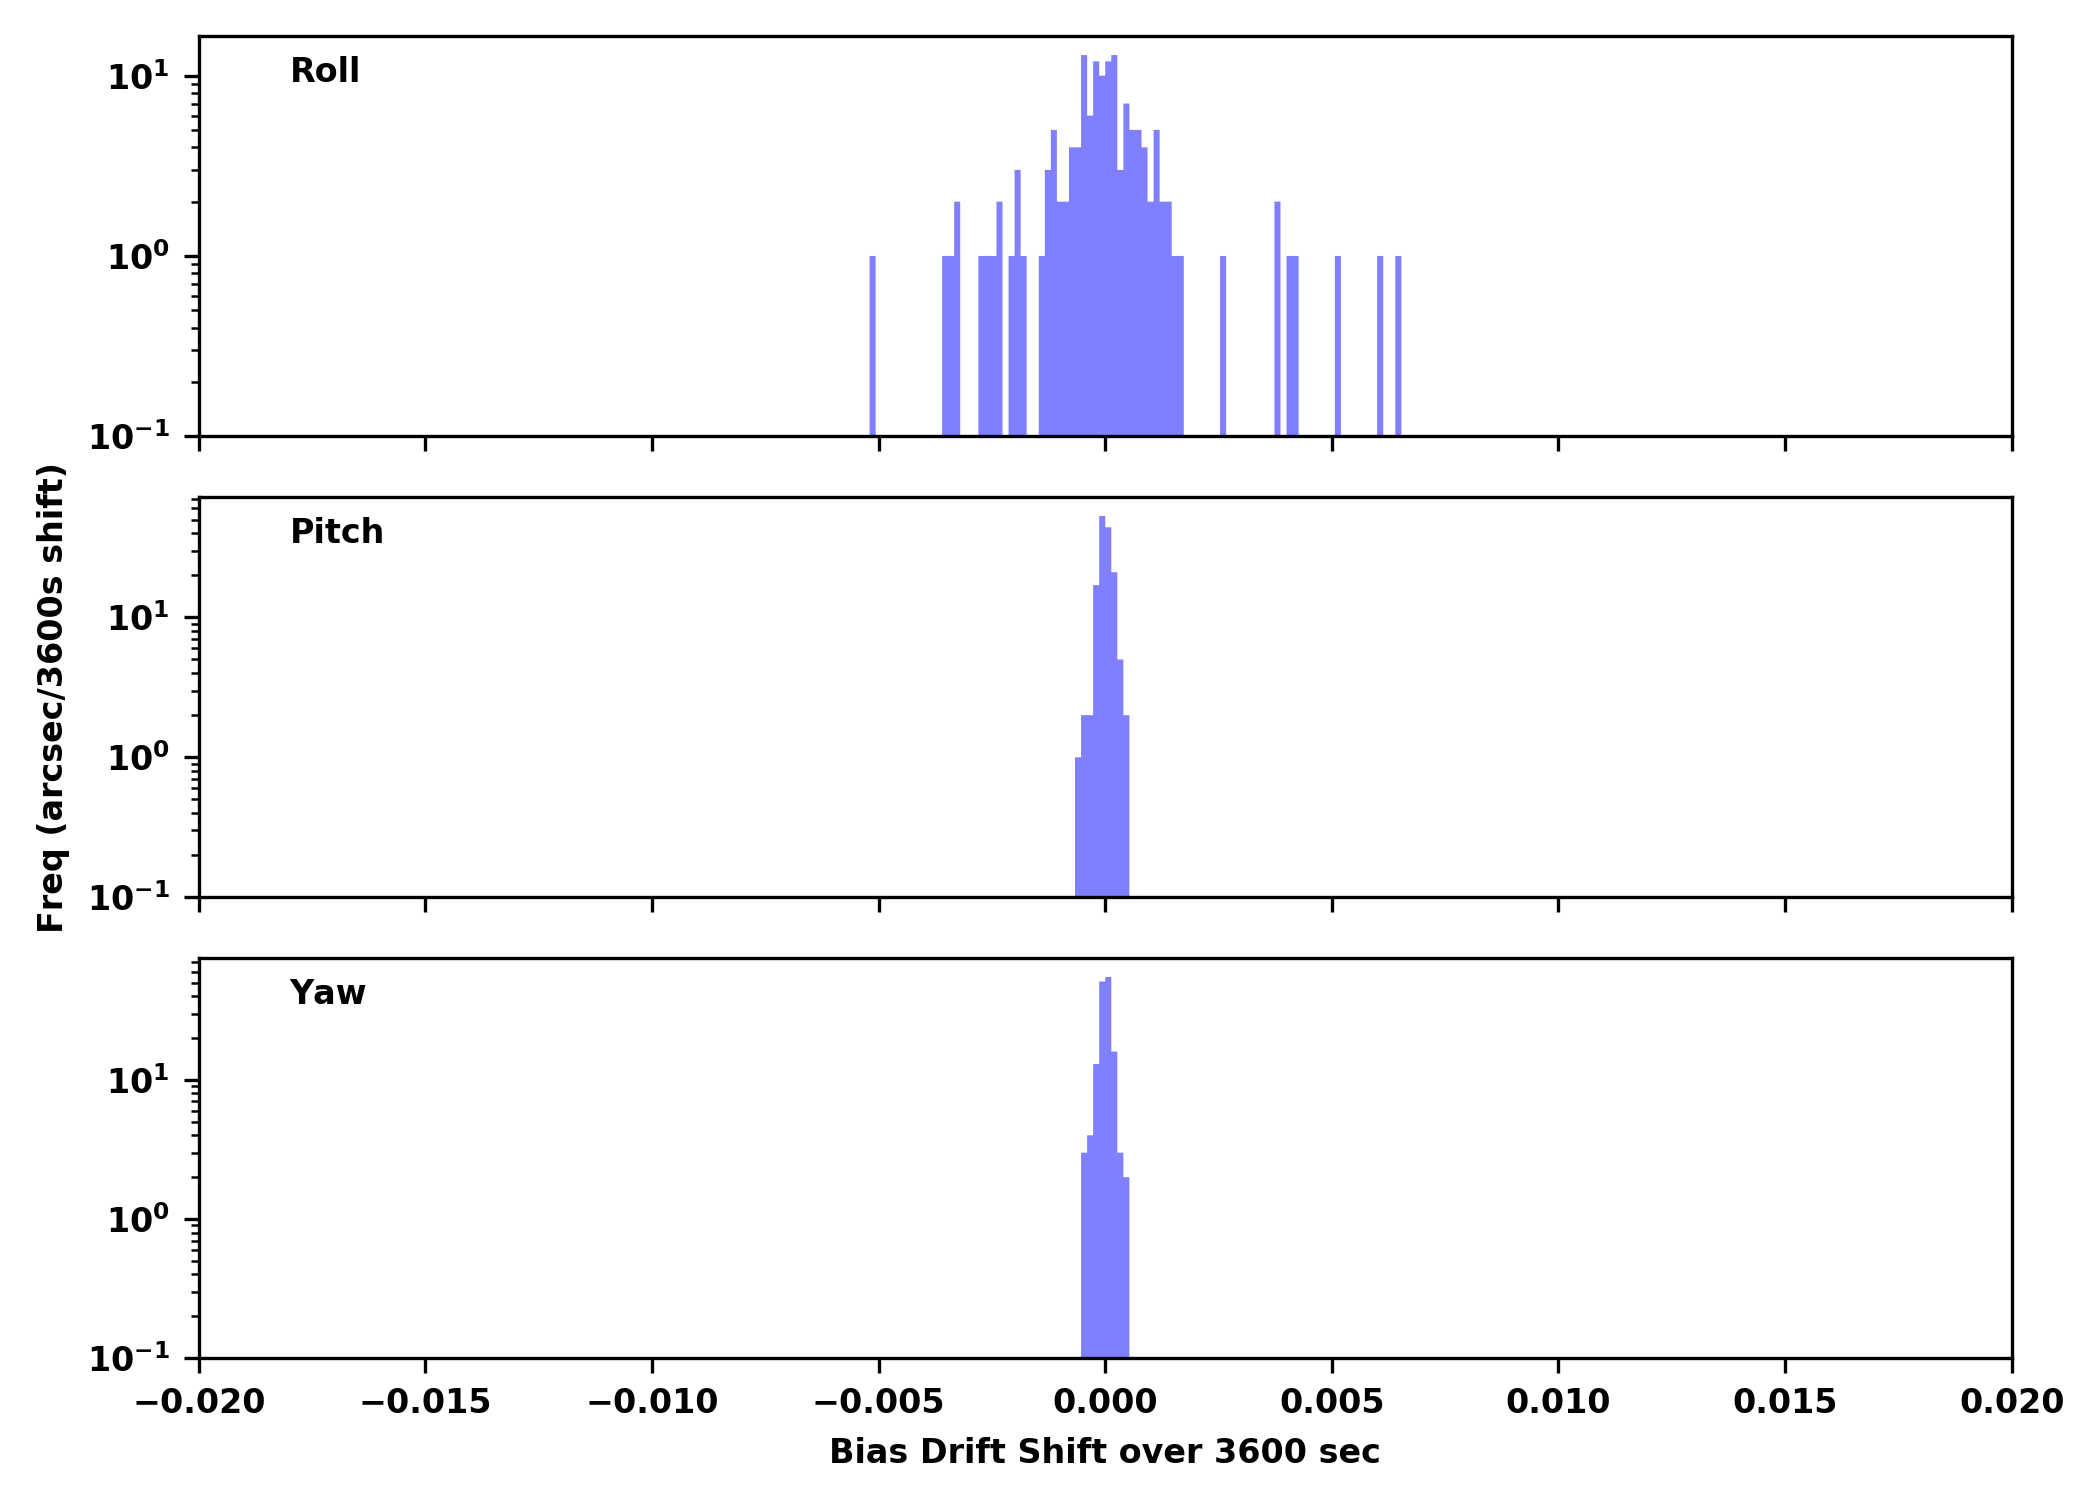
IRUs
| Gyro Bias Drift | Gyro Bias Drift Histogram |
|---|---|
|
|
Recent Observations
| OBSID | DETECTOR | GRATING | TARGET | ANALYSIS | ACA |
|---|---|---|---|---|---|
| 21482 | ACIS-3678 | NONE | Spiderweb | OK | OK |
| 23206 | ACIS-456789 | HETG | Orion Nebula Cluster | OK /Grat | OK |
| 22927 | ACIS-3678 | NONE | Spiderweb | OK | OK |
| 23209 | ACIS-5678 | NONE | J1818-1607 | OK | OK |
| 23205 | ACIS-3678 | NONE | Spiderweb | OK | OK |
| 22300 | ACIS-23678 | NONE | 120751.8-043439 | OK | OK |
| 23207 | ACIS-456789 | HETG | Orion Nebula Cluster | OK /Grat | OK |
| 21442 | ACIS-5678 | NONE | 2M 1134-2103 | OK | OK |
| 22957 | HRC-S | LETG | H1821+643 | OK /Grat | OK |
| 23208 | ACIS-456789 | HETG | Orion Nebula Cluster | OK /Grat | OK |
| 23204 | ACIS-35678 | NONE | 1321+045 | OK | OK |
| 21557 | ACIS-01236 | NONE | CIZA J0107.7+5408 | OK | OK |
| 22723 | ACIS-012367 | NONE | PKS 0620-52 | OK | OK |
| 23210 | ACIS-01236 | NONE | CIZA J0107.7+5408 | OK | OK |
| 21652 | ACIS-012367 | NONE | JWST-DTDF-9 | OK | OK |
| 22356 | HRC-I | NONE | HD 114174 | OK | OK |
| 23212 | ACIS-012367 | NONE | JWST-DTDF-9 | OK | OK |
| 22655 | ACIS-0123 | NONE | SPT-CLJ1315-2806 | OK | OK |
| 22531 | ACIS-7 | NONE | SDSS J1346+5858 | OK | OK |
Trending
This week's focus is PCAD
Last reported on
Jan 23.
Only the most interesting or representative msids are shown below.
For a full listing choose the bulletted link.
| MSID | Mean | RMS | Delta/Yr | Delta/Yr/Yr | Unit | Description | |
|---|---|---|---|---|---|---|---|
| afsspc2v | on | 0.010 | 0.001 | 3.51 +/- 0.20 | (1.08+/-2.16)e-4 | V | FSS POWER CONV 2 VOLTAGE | off | 5.690e-04 | 5.353e-04 | 0.01 +/- 0.14 | (0.00+/-0.00)e0 |
| airu2g1i | on | -0.163 | 0.009 | (1.04+/-0.04)e2 | -0.03 +/- 0.05 | mA | IRU-2 GYRO | off | -0.377 | 0.112 | 9.75 +/- 4.56 | -0.18 +/- 0.39 |
| airu2g2i | on | 1.334 | 0.018 | (1.08+/-0.09)e2 | 0.28 +/- 0.07 | mA | IRU-2 GYRO | off | -0.376 | 0.114 | 9.75 +/- 4.64 | -0.12 +/- 0.35 |
| airu2g2t | on | -0.439 | 0.016 | (3.41+/-0.07)e2 | -(5.25+/-30.69)e-4 | K | IRU-2 GYRO | off | -0.230 | 0.066 | (2.93+/-0.03)e2 | -0.02 +/- 0.02 |
| MSID | Mean | RMS | Delta/Yr | Delta/Yr/Yr | Unit | Description | |
|---|---|---|---|---|---|---|---|
| aogyrct1 | -3.199 | 0.759 | 9.23 +/- 388.16 | -15.20 +/- 14.20 | CNTS | ACCUMULATED GYRO PULSE COUNTS FROM OBC SELECTED GYRO 1 | |
| aogyrct2 | 0.879 | 0.376 | 2.43 +/- 193.24 | 2.34 +/- 8.21 | CNTS | ACCUMULATED GYRO PULSE COUNTS FROM OBC SELECTED GYRO 2 | |
| aogyrct3 | 2.555 | 4.009 | -12.37 +/- 2089.95 | 6.14 +/- 63.44 | CNTS | ACCUMULATED GYRO PULSE COUNTS FROM OBC SELECTED GYRO 3 | |
| aogyrct4 | 0.746 | 0.328 | -1.85 +/- 167.72 | 2.33 +/- 6.90 | CNTS | ACCUMULATED GYRO PULSE COUNTS FROM OBC SELECTED GYRO 4 |
If you have any questions, please contact: swolk@head.cfa.harvard.edu