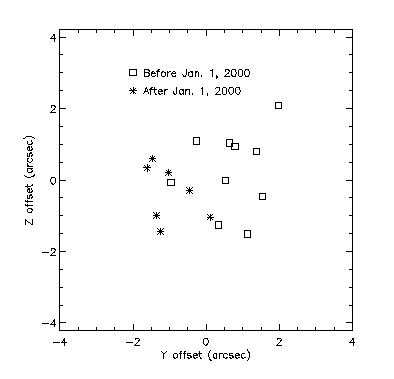
The basic idea is to determine the position on the detector of bright point sources with well-known celestial coordinates. To concentrate purely on pointing performance, only observations from a single SI were selected. Given this constraint, ACIS-S (predominantly with the HETG) provides the largest dataset. For each observation, the mean CHIPX and CHIPY for source photons was corrected to remove any SIM-Z offset (from the nominal -190.14 mm) or pointing offset. After correction, the mean CHIPX and CHIPY for an observation with no offsets is:
    CHIPX = 251.8
    CHIPY = 509.5
The plot below shows the corrected offset (arcsec) from the mean for the 17
observations. Recent observations are plotted with an asterisk. The worst
case from this mean is about 2.0 arcsec in each axis, while the rest are
within a 2 arcsec radius of the mean.

The 17 points in the analysis can be statistically characterized following the prescription of the TRW requirements document SE31:
99% radial limit = sqrt( E(DY^2 + DZ^2)/2 ) * 3.035
  where E(X) = expectation value of X
The 99% limit for these 17 points is 3.3 arcsec. This can be compared to the requirement of 30 arcsec. Clearly the distribution (and potential large pointing errors) are not gaussian, and this 99% value must be interpreted with caution. A more useful measure is simply the worst radial deviation of 2.8 arcsec. Multiplying this by a safety margin of 3 gives a conservative upper limit of a 9 arcsec radius on the absolute pointing error. This should be used for planning observations which require precise pointing (e.g. an ACIS sub-array observation).
The following table gives the mean location in CHIPX and CHIPY of the source for each observation, the relevant observation parameters, and the corrected offset (DY and DZ) in arcsec. (Y and Z refer to spacecraft coordinates).
Obsid     RA        Dec       Date  Grating  CHIPX  CHIPY   SIM_Z  OFFSET_Y   DY    DZ
         deg       deg                      pixels pixels    mm    deg     arcsec arcsec
---------------------------------------------------------------------------------------
0106  287.9562    4.9827  1999-09-23  HETG   254.6  511.1  -190.14  0.0000    1.3   0.7
0016   82.1866  -65.4488  1999-10-09  HETG   253.1  511.6  -190.14  0.0000    0.6   1.0
0333   49.9504   41.5116  1999-10-10  HETG   255.8  513.7  -190.14  0.0000    1.9   2.0
0105  250.2312  -53.7513  1999-10-20  HETG   254.9  508.6  -190.14  0.0000    1.5  -0.4
1456  308.1062   40.9576  1999-10-20  HETG   254.1  506.5  -190.14  0.0000    1.1  -1.5
0337  329.7166  -30.2255  1999-10-20  HETG   253.4  511.4  -190.14  0.0000    0.7   0.9
0376  322.3004  -15.6450  1999-11-16  NONE   252.5  507.0  -190.14  0.0000    0.3  -1.2
1481  327.9812  -30.4649  1999-11-20  HETG   252.9  392.0  -187.32  0.0000    0.5  -0.0
0336  327.9812  -30.4649  1999-11-18  HETG   249.9  391.9  -187.32  0.0000   -0.9  -0.0
0457  166.1133   38.2088  1999-11-05  HETG   251.3  349.2  -186.24  0.0000   -0.2   1.0
0489  187.2778    2.0523  2000-01-10  HETG   250.9  383.1  -187.12  0.0000   -0.5  -0.3
0605   51.6474   28.7150  2000-01-12  HETG   248.9  385.3  -187.13  0.0000   -1.4   0.5
0837  214.4983   25.1367  2000-02-05  HETG   248.6  510.2  -190.14  0.0000   -1.6   0.3
0614  202.6950   24.2327  2000-03-27  HETG   290.4  380.8  -187.12 -0.0056   -1.2  -1.4
0640  120.8960  -40.0031  2000-03-28  HETG   290.1  384.1  -187.12 -0.0055   -1.0   0.1
0604   47.0422   40.9556  2000-04-01  HETG   249.1  381.7  -187.12  0.0000   -1.3  -1.0
0610   85.1896   -1.9425  2000-04-08  HETG   332.7  381.6  -187.12 -0.0110    0.0  -1.0
---------------------------------------------------------------------------------------