MCP Total Rate Threshold in RADMON
Introduction
The RADMON process was patched on 2004 day 245 to allow for the use of
HRC data (antico. shield and MCP total rates) in the
identification of a high radiation environment.
Flight Note 443: HRC Use in
RADMON Process discusses the merits of the use of the
antico. shield rate and proposes a threshold value and decision
flow for the use this rate within the RADMON process but does not
address a threshold and use of the MCP total rate.
Since the HRC MCP HV is only raised to its operating level if there is
an HRC observation during the orbit, there is less data available
for an analysis of its past performance.
This limited "ON" time also makes it less useful in general as a
safing trigger but it would provide an ideal trigger for
protecting the HRC MCPs.
In this memo, I review the available MCP total rate data from times
just prior to shut-down by runs of SCS-107 due to radiation (both
autonomous and via ground command).
Given the limited performance data available during times of high
radiation I combine it with data from the observed total
counts (mostly due to the cosmic-ray background) to derive a
proposal for a threshold that could be used within the RADMON
process.
Finally, I discuss the merits of implementing the monitoring of this
channel within the RADMON process.
MCP Total Rate Before High Radiation Safing
Throughout the mission the HRC has been operated such that the MCP HV
for the currently selected detector is not raised to the operating
level until the first HRC observation in a given orbit.
The MCP HV is left at the operational level until:
- 10 ks before the AE8 forecast radiation zone entry
- The schedule calls for a change of HRC detector (HRC-I to HRC-S or
visa-versa)
- Spacecraft dither is disabled
- The HV is explicitly ramped-down in the load to satisfy other HRC
operations constraints (e.g. bright source)
- SCS-107 is activated and runs to completion
If there are no HRC observations during a given orbit, then the MCP HV is
not raised to the operational level.
Given the lower rate of utilization of the HRC in the Chandra
observing program, there are many orbits during which the HRC MCP
HV is not at the operational level.
Of the 62 occasions to date (early June 2006) for which the mission
was stopped due to "high" radiation (either autonously or via
ground command), the HRC MCP HV was at the operational level for
10.
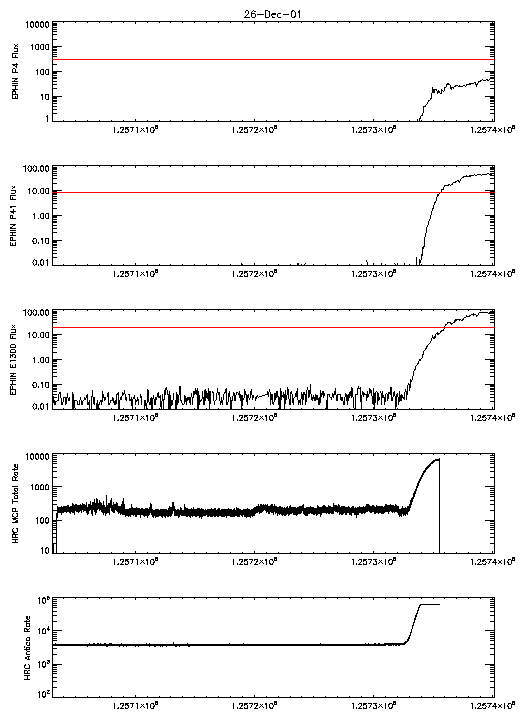
Figure 1 shows the fluxes in the three monitored EPHIN channels,
the HRC MCP total rate and the HRC antico rate for time leading up
to the SCS-107 run on day 2001:360.
This RADMON activation of SCS-107 was caused by a high flux in the
EPHIN E1300 channel, with the P41GM channel exceeding threshold
shortly after and provides the strongest example of the MCP response to
high-energy particles.
There is an obvious increase in the MCP total rate as the high-energy
particle fluxes increase.
 |
| Figure 1: Flux in the three EPHIN channels monitored within
the RADMON process and the HRC MCP total and antico shield
rates prior to the SCS-107 trigger of 2001:360. The red
horizontal lines on the EPHIN flux plots are the current
RADMON thresholds; for most RADMON triggers (including
this one) the E1300 threshold was half its current
value. |
The following is a tabulation of the radiation-safing events for which
the MCP HV was at the operational level at the time of the SCS-107
activation.
The links go to plots of the fluxes and rates similar to
figure 1.
| Event Date | Cause |
|---|
| 2001:228 |
Autonomous activation due to EPHIN E1300 |
| 2001:324 |
Ground activation due to ACE P3 fluence |
| 2001:360 |
Autonomous activation due to EPHIN E1300 (shown in Figure 1) |
| 2003:297 |
Ground activation due to ACE P3 fluence |
| 2003:336 |
Autonomous activation due to EPHIN P4GM |
| 2004:210 |
Autonomous activation due to EPHIN E1300 at the fringe of the
radiation zone |
| 2004:257 |
Autonomous activation due to EPHIN P4GM and E1300 |
| 2004:312 |
Ground activation due to ACE P3 fluence |
| 2005:134 |
Autonomous activation due to P4GM |
| 2006:080 |
Autonomous activation due to EPHIN E1300 at the fringe of the
radiation zone |
For these events the MCP total rate displays evidence for an
increase for only the E1300 events and one of the ACE P3 events
which had the HRC at the aim-point of the telescope.
Observed HRC MCP Counts Dose
Since our on-orbit experience with MCP rates relative to EPHIN fluxes
provides limited data from which to develop a RADMON threshold, we
can look to deriving a threshold from the observed on-orbit dose.
Limiting the counts dose from a high-radiation event to a fraction of
the observed annual counts dose should not lead to an appreciable
increase in degradation to the MCPs.
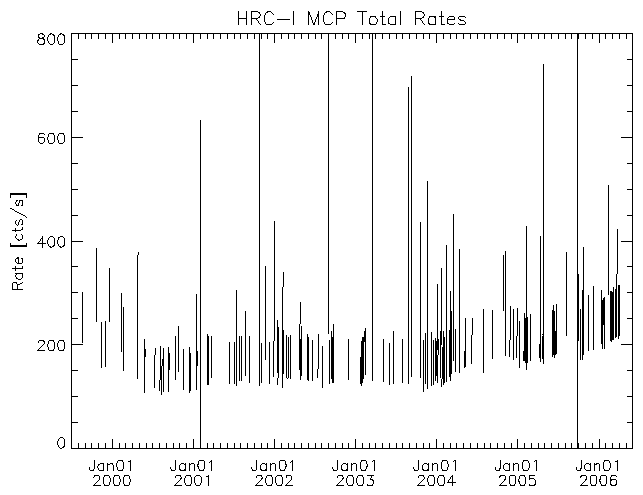
Figure 2 shows the HRC-I MCP total rate history from launch to
the beginning of 2006 April. The vertical lines display the range
of observed rates during a continuous interval of time with the
MCP HV at the operational level.
 |
| Figure 2: HRC-I MCP total rate vs time since launch. |
The data in figure 2 was extracted from the HRC secondary science
telemetry using continuous time intervals over which the HRC-I MCP
HV was observed to be at the operational level and attempting to
filter out "glitches" created during telemetry format changes by
iteratively clipping the rate.
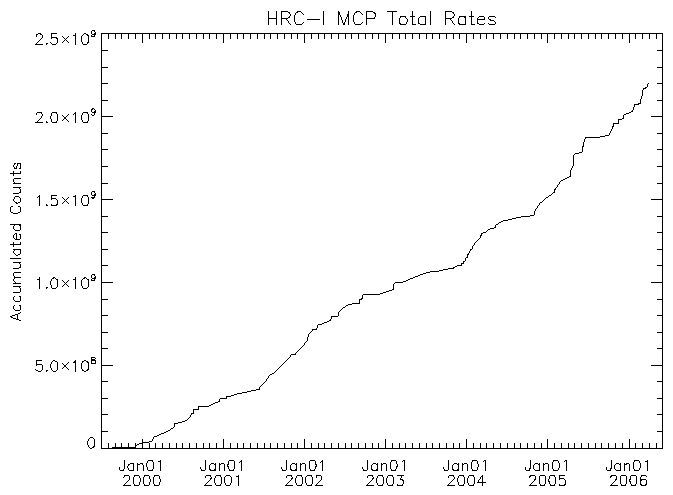
The total counts dose can be obtained from the data by summing the
products of the mean rate over the interval and the interval
duration; the resulting total accumulated counts in the HRC-I as a
function of time is shown in figure 3.
 |
| Figure 3: HRC-I accumulated counts history. |
In a little over six years of operation the HRC-I MCP has recorded
about 2.2×10⁹ counts.
The data for the HRC-S (rate
and accumulated counts)
are very similar with the total counts being slightly less due to
a slightly shorter time spent with its MCP HV at the operational
level.
Most of the time with the MCP HV at the operational level has been
spent with ACIS observing and the HRC at the stowed location and
is dominated by the cosmic-ray background.
The cosmic-ray background is essentially uniformly spread over the
detector area so this counts dose corresponds to 30-35 counts per
MCP pore (for reference note that laboratory tests showed a 10%
reduction in MCP gain at a dose of ~500 counts per MCP pore).
While the background rate typically remains below 300 counts/s,
during HRC observations X-rays from the target source will add
to this rate as will the contribution from the flaring,
low-energy-proton background component.
The rate due to X-rays (or out-of-band photons) can be as high as a
few hundreds of counts/s (e.g. the Vega observations on the MCP
wing segments or the Crab pulsar observations) and the added
rate persists throughout the observation.
The flaring background can reach rates of a few thousand but this only
happens for short bursts relative to the 10 minutes over which
the RADMON process samples the rates.
Proposed MCP Total Rate Threshold
The 2001:360 safing event provides one sample of the MCP rate during a
high-radiation event, with the rate reaching ~7000 counts/s
before SCS-107 ramped down the MCP HV.
The observed total counts dose to the MCP per year is roughly
3.7×10⁸.
If we imagine that only the MCP rate were available for identifying a
high-radiation environment and that Chandra was in a high
radiation environment where the MCP rates are sustained at a near
constant level just below the safing threshold from just after the
conclusion of one comm. pass until a subsequent pass 12 hours
later then the MCP total rate would have to be
~8500 counts/s to provide the equivalent of the annual dose.
Setting the MCP threshold value in the 5000—10,000 counts/s
range seems appropriate provided that rates this high are not
routinely observed due to the added contributions from the target
X-rays and flaring background.
The RADMON process uses data for the MCP total rate that is
telemetered as MSID 2DETART (or 2DETBRT if we switch to the HRC
B-side CEA).
This MSID only reflects the high-order byte of the rate and so a rate
of 5000 counts/s would correspond to a 2DETART value of 19.
There have been four instances during the entire mission to date when
the telemetry shows 2DETART exceeding a value of 19.
One of these instances was the 2001:360 radiation-safing event, during
which the value of 19 was exceeded for roughly ten minutes
before the MCP HV was reduced.
Two of the instances were brief (~10 and ~40 seconds) busts during
periods of elevated rates prior to radiation zone entry (on days
2003:142 and 2003:324); the antico shield rates rose at these
times as well.
The final event was a single high sample on day 2004:362 for which the
secondary-science scalar rates showed a corresponding "blip".
There have been no cases of MSID 2DETART with a value of 30
(corresponding to ~7900 counts/s) or higher.
I propose using a "2DETART" threshold value 29.5; in other words, the
OBC would run SCS-107 once we have ten consecutive samples (one
sample every 65.6 s) of 2DETART within the RADMON process with a
value of 30 or higher).
Merits of Implementation
The EPHIN currently provides our only autonomous monitor of the
Chandra radiation environment.
The continuing degradation of the EPHIN thermal control surfaces is
expected to lead to ever higher unit temperatures and the
possibility of an eventual, possibility sudden, loss of some of its
capabilities.
Actively monitoring the MCP rate and safing the science instruments
when the rate is elevated would certainly add to the safety of the
HRC and to the extent that the radiation damages the ACIS it would
offer some protection to it as well.
Flight Note 443 presented
arguments for delaying the use of the HRC antico. shield rate as
an actively monitored channel within the RADMON process; due to
the potential for unwanted RADMON safing triggers.
By setting the MCP rate threshold at a high enough level the
possibility of a false trigger is minimized; the proposed
threshold of 29.5 provides a reasonable margin of protection
against high-energy particles in the case of a sudden loss of
EPHIN sensitivity in its higher energy channels while avoiding
unwanted triggers of the SCS-107 safing actions.
To the extent that the E1300 channel in the RADMON process is not
needed for the protection of ACIS, the MCP total rate could be
used to replace it. This would have the benefit of eliminating
the possibility of some unwanted RADMON triggers on the fringes
of the radiation zones. The following table lists the past RADMON
triggers that would have had a difference relative to the
current response if the E1300 channel were not used for safing.
The "Event Date" column links go to plots of the time history of the
fluxes in the three monitored EPHIN channels (E1300, P4, and
P41) around the RADMON trip time. The current threshold levels
are indicated by the horizontal red lines. The RADMON trigger time
is given by the solid red vertical line, while the trigger time
without the E1300 channel (if there is one) is given by the
dashed red vertical line. For the day 2006:080 event the RADMON
disable time is given by the solid black vertical line. Four of
the nine triggers do not show a significant delay without the
E1300 channel. The 2006:080 event was an unwanted trigger, due
to the fringe of the radiation zone.
The day 2001:228 event, which has a long delay to trigger without the
E1300 channel, was one where the MCP HV was at the operational
level the the time that RADMON activated SCS-107. Given the
observed response in the MCP rate it is possible that without
the E1300 channel the event could have been triggered by the MCP
rate being exceeded earlier than by the P41GM channel.
The remaining three events 2005:234, 2005:251, and 2005:257 all exhibit
a slow rise in radiation levels, with the latter two requiring
the E1300 for a RADMON trip. Since the MCP HV was not at the
operational level for these events, it is not clear what result
monitoring the MCP total rate in RADMON would have
produced. Ground intervention would likely be necessary to
provide earlier (or any) safing for radiation environments
similar to these if it were desired; the slow rate of increase
in the radiation level presumably minimizes any possible damage
to the science instruments.
Last modified: Mon Jul 24 15:48:08 EDT 2006
Dr. Michael Juda
Harvard-Smithsonian Center for Astrophysics
60 Garden Street, Mail Stop 70
Cambridge, MA 02138, USA
Ph.: (617) 495-7062
Fax: (617) 495-7356
E-mail: mjuda@cfa.harvard.edu


