|
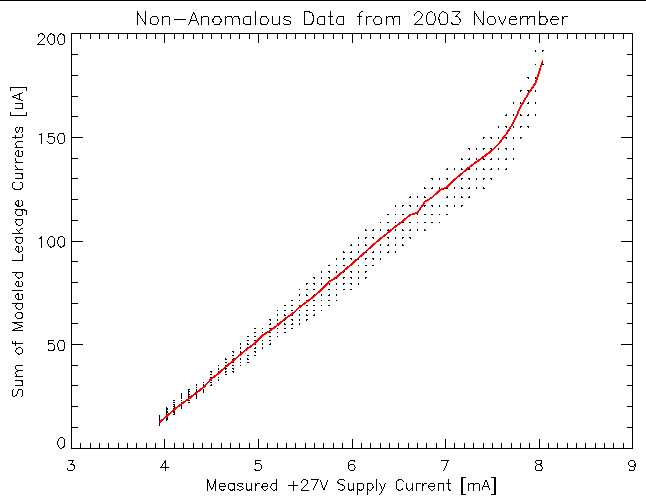
| Figure 1: Scatter plot of the sum of the modeled detector leakage currents versus the +27V supply current. The trend in the mean value of the modeled sum with supply current is over-plotted in red. |
The sum of the modeled leakage currents provides a surrogate for the sum of the measured ones for exploring the region where the measured ones exceed the telemetry ceiling. While the models are extrapolations outside of where we can ever observe the leakage current versus temperature behavior, it is the modeled behavior that we are using to derive the threshold temperature. Figure 1 is a scatter plot of the sum of the modeled detector leakage currents versus the +27V supply current for the 2003 November data where the +27V supply was functioning nominally. Over-plotted is the mean value of the summed leakage current for all samples at a given +27V supply current. There is an obvious up-turn in the relationship once the +27V supply current exceeds 7.6 mA.
|
|
| Figure 1: Scatter plot of the sum of the modeled detector leakage currents versus the +27V supply current. The trend in the mean value of the modeled sum with supply current is over-plotted in red. |
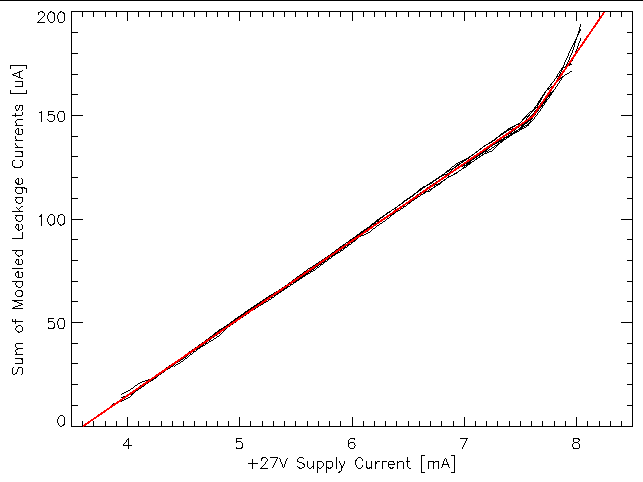
The +27V supply current first exceeded 7.6 mA on 2003-Sep-17. All of the time when the supply current exceeded 7.6 mA the detector E leakage current was above its telemetry ceiling; the detector D leakage current was above its ceiling for much of this time as well. In order to spot any potential trend in the up-turn in the relationship between the leakage current sum and the supply current I examined the relation using data in month-long blocks (nine data sets from 2003-Sep to 2004-May). Figure 2 shows the mean sum of the modeled leakage currents as a function of +27V supply current. Also plotted are the mean linear fits to the data above and below 7.6 mA.
|
| Figure 2: Means of the sum of the modeled leakage currents vs the +27V supply current in month-long blocks from 2003-Sep to 2004-May are black curves. Over-plotted in red are the mean linear fits to the data sets above and below a +27V supply current of 7.6 mA. |
The table below contains the linear fit coefficients to the month-long data blocks. There are, as of now, no obvious trends in the fit coefficients with time. The mean values in the table were used for the lines over-plotted in red in figure 2.
| +27 V current < 7.6 mA | +27V current > 7.6 mA | |||
|---|---|---|---|---|
| Month | A | B | A | B |
| 2003-Sep | 3.598 | 0.02720 | 5.459 | 0.01440 |
| 2003-Oct | 3.628 | 0.02669 | 5.608 | 0.01332 |
| 2003-Nov | 3.601 | 0.02693 | 5.957 | 0.01122 |
| 2003-Dec | 3.599 | 0.02682 | 6.229 | 0.00948 |
| 2004-Jan | 3.572 | 0.02732 | 5.539 | 0.01399 |
| 2004-Feb | 3.610 | 0.02639 | 5.562 | 0.01347 |
| 2004-Mar | 3.595 | 0.02661 | 6.001 | 0.01070 |
| 2004-Apr | 3.626 | 0.02625 | 5.499 | 0.01389 |
| 2004-May | 3.616 | 0.02672 | 5.605 | 0.01341 |
| Means | 3.605 | 0.02677 | 5.718 | 0.01265 |
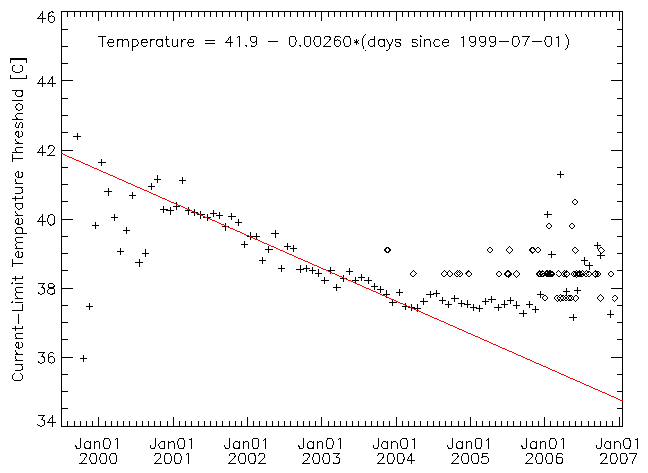
Plotted in figure 3 is the threshold temperature for the EPHIN sensor-head thermistor (MSID 5EPHINT) derived from when the sum of the modeled detector leakage currents exceeds 180 µA. Also shown on the plot as diamond symbols are the observed points at which the +27V supply voltage dropped. The difference between the observed onset and the updated modeled threshold is now below 1 C, which is easily accounted for by the lag in the thermal response.
|
| Figure 3: EPHIN sensor-head temperature (MSID 5EPHINT) threshold derived from the sum of the modeled leakage currents. Plus symbols are where the summed leakage current fits from the month-long data blocks exceed 180 µA. Diamond symbols show the observed onset of the drop in the +27V voltage. The solid red line is a linear fit the the trend for times after 2001-Jan-01. |
The derived threshold values can be reasonably be represented with a linearly decreasing trend:
This threshold should be conservative as the time-lag between the sensor-head thermistor and the detector temperature will provide some margin. From a practical viewpoint, since the rate of change in the threshold is so low, providing a list of threshold values which a valid for a month for mission planning purposes ought to provide sufficient resolution to track any changes. Below is a table with the derived thresholds for 2004.
| Month | 5EPHINT Threshold [C] |
|---|---|
| 2004-Jan | 37.6 |
| 2004-Feb | 37.5 |
| 2004-Mar | 37.4 |
| 2004-Apr | 37.4 |
| 2004-May | 37.3 |
| 2004-Jun | 37.2 |
| 2004-Jul | 37.1 |
| 2004-Aug | 37.0 |
| 2004-Sep | 37.0 |
| 2004-Oct | 36.9 |
| 2004-Nov | 36.8 |
| 2004-Dec | 36.7 |
The values in this table can be used as the reference level against which any margin on the prediction for the 5EPHINT temperature profile as a function of attitude produced by the FOT thermal model must be applied. A text file covering a longer time period is available; however, the relationship between the sum of the modeled leakage currents and the +27V supply current should be examined periodically (e.g. every six months) in order to detect any change in the threshold leakage current value. Additionally, trends in the derived threshold temperature with time should be tracked, presumably using the same update cycle as the model leakage to supply current relationship.
Dr. Michael Juda
Harvard-Smithsonian Center for Astrophysics
60 Garden Street, Mail Stop 70
Cambridge, MA 02138, USA
Ph.: (617) 495-7062
Fax: (617) 495-7356
E-mail:
mjuda@cfa.harvard.edu