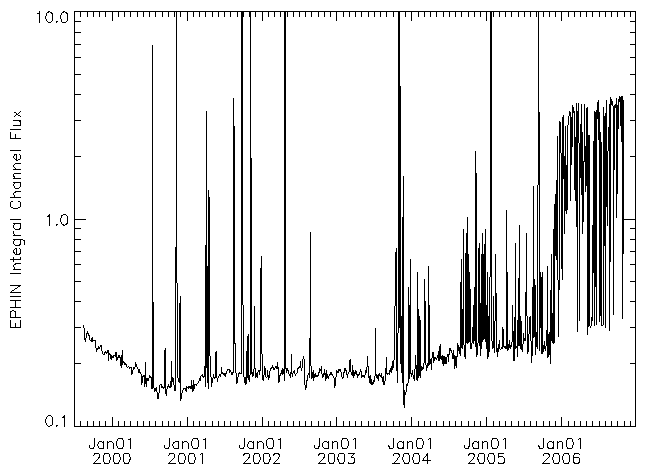
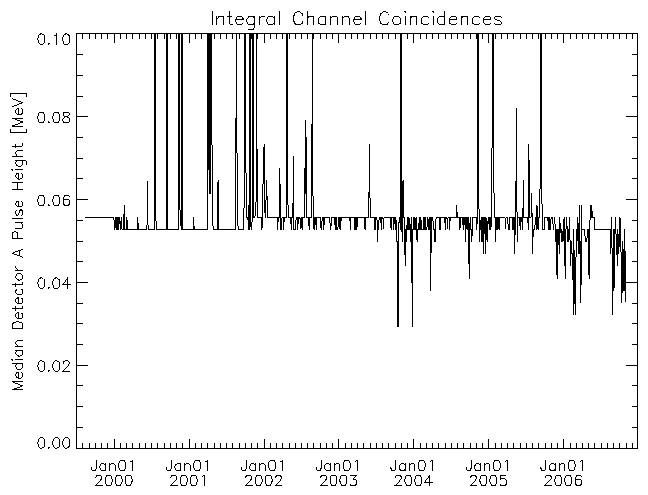
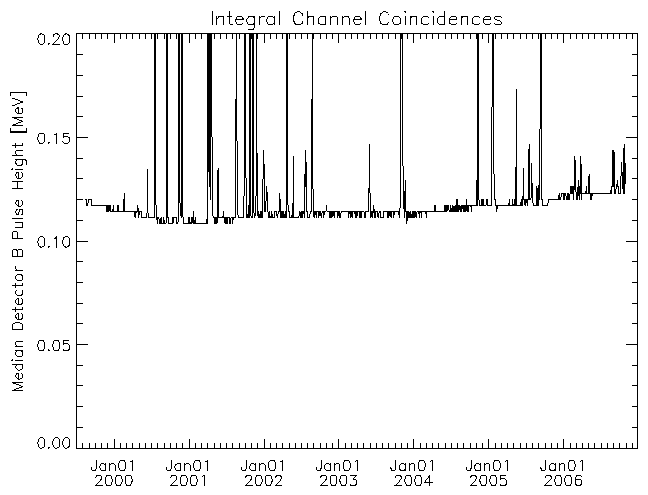
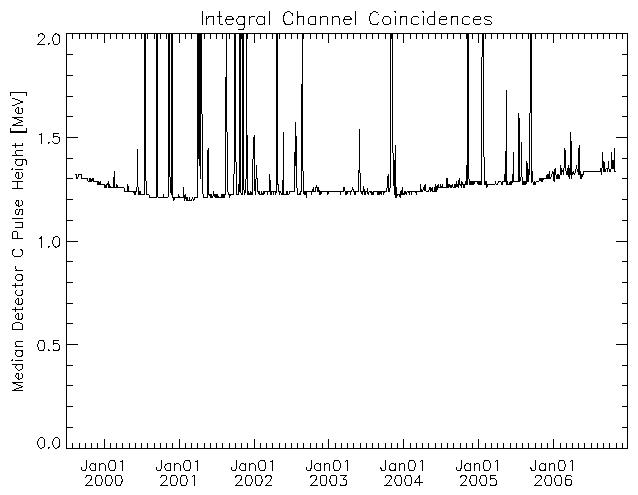
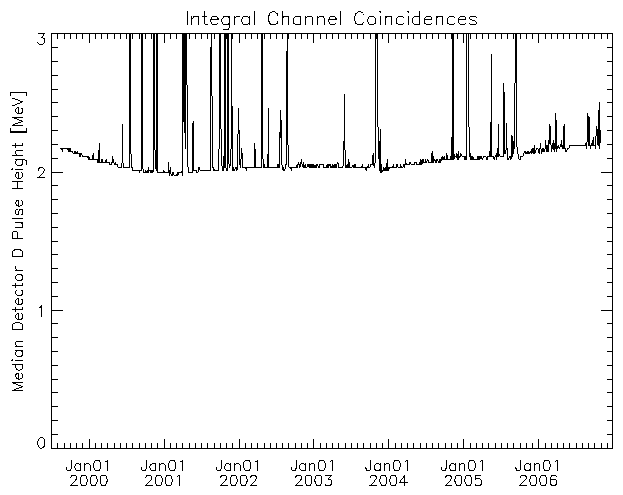
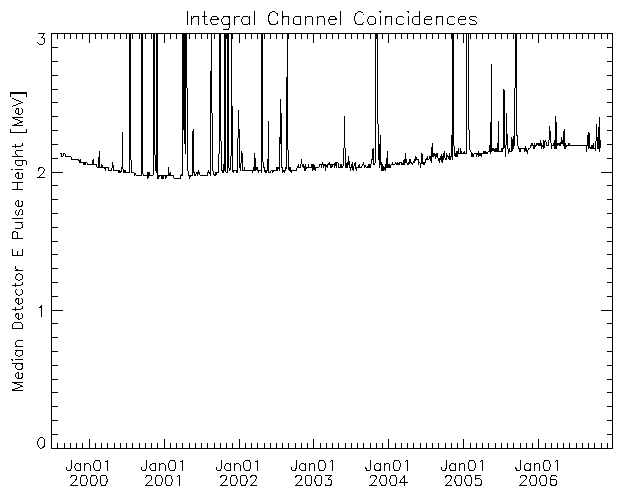
The modulation of the flux due to the solar-activity cycle is evident. This modulation also appears in the median PHAs and dominates any trend that may be due to detector degradation with the possible exception of detector A.
|
|
| Figure 1: Median EPHIN INT Channel flux |
|
| Figure 2: Median Detector A PHA for INT Channel Coincidences |
|
| Figure 3: Median Detector B PHA for INT Channel Coincidences |
|
| Figure 4: Median Detector C PHA for INT Channel Coincidences |
|
| Figure 5: Median Detector D PHA for INT Channel Coincidences |
|
| Figure 6: Median Detector E PHA for INT Channel Coincidences |
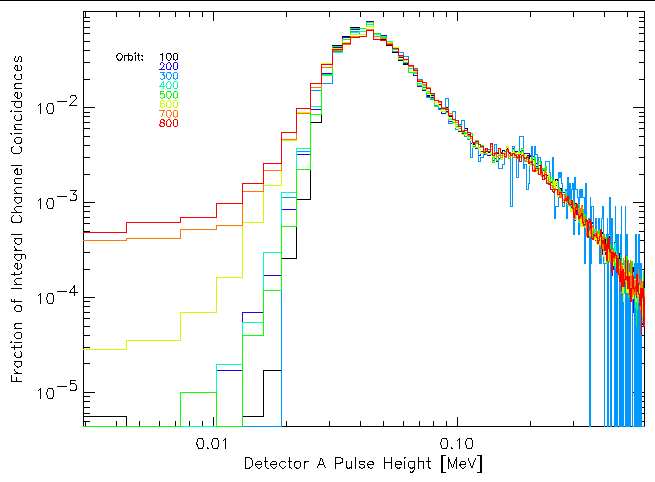
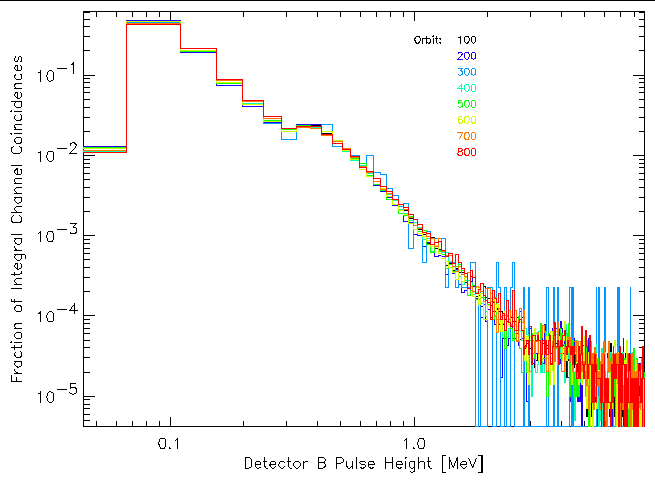
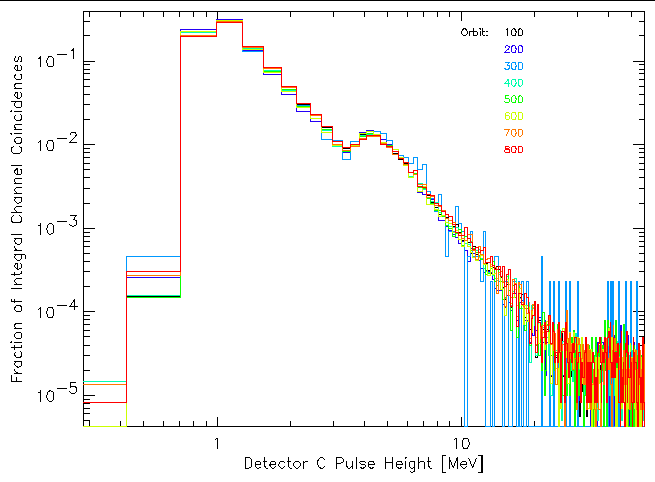
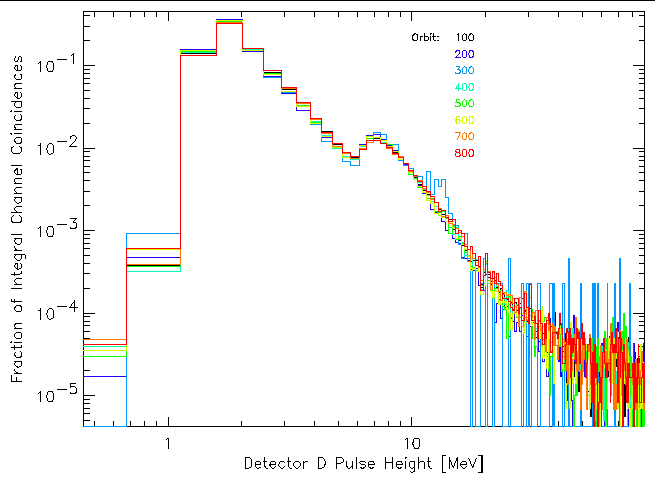
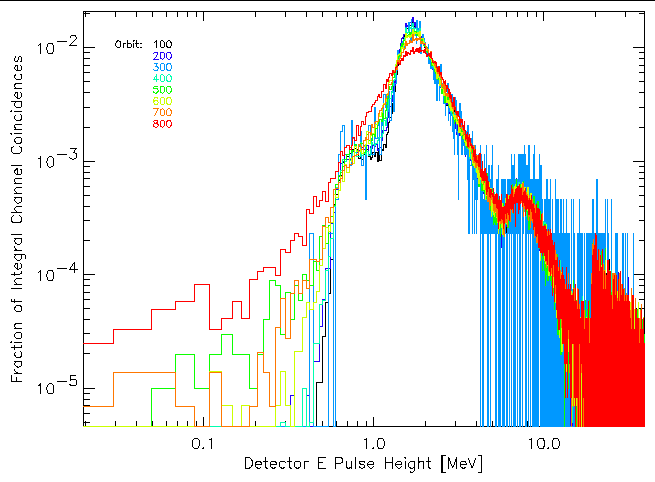
The median pulse height is a simple, easy-to-generate metric but it doesn't tell the whole story. There is more information in the pulse-height distribution that may provide earlier visibility into changes in the detector performance. The plots below the trend (or lack thereof) in the shape of the pulse-height distribution for each of the detectors by plotting the distribution of the Integral channel coincidences for the times when the geocentric distance was greater than 80,000 km for orbits 100, 200, 300, 400, 500, 600, 700, and 800. Only detectors A and E show any significant change in the shape of the pulse-height distributions.
|
| Figure 7: Trend in detector A pulse-height distributions with time (i.e. orbit number). Only Integral channel coincidences are included in the distributions. |
|
| Figure 7: Trend in detector B pulse-height distributions with time (i.e. orbit number). Only Integral channel coincidences are included in the distributions. |
|
| Figure 7: Trend in detector C pulse-height distributions with time (i.e. orbit number). Only Integral channel coincidences are included in the distributions. |
|
| Figure 7: Trend in detector D pulse-height distributions with time (i.e. orbit number). Only Integral channel coincidences are included in the distributions. |
|
| Figure 7: Trend in detector E pulse-height distributions with time (i.e. orbit number). Only Integral channel coincidences are included in the distributions. |
Last modified: Mon May 1 11:10:56 EDT 2006
Dr. Michael Juda
Harvard-Smithsonian Center for Astrophysics
60 Garden Street, Mail Stop 70
Cambridge, MA 02138, USA
Ph.: (617) 495-7062
Fax: (617) 495-7356
E-mail:
mjuda@cfa.harvard.edu