| Pre- | Post- |
|---|---|
 |
 |
 |
 |
 |
 |
 |
 |
 |
 |
 |
 |
 |
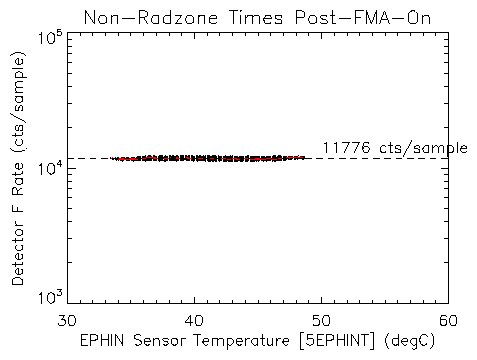 |
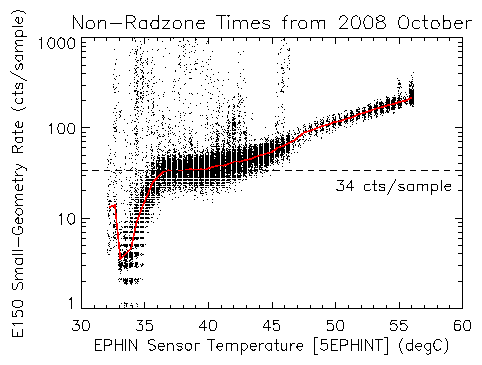
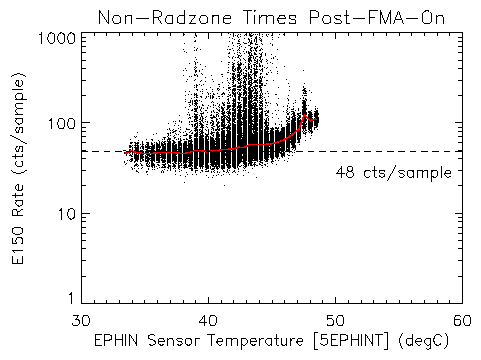
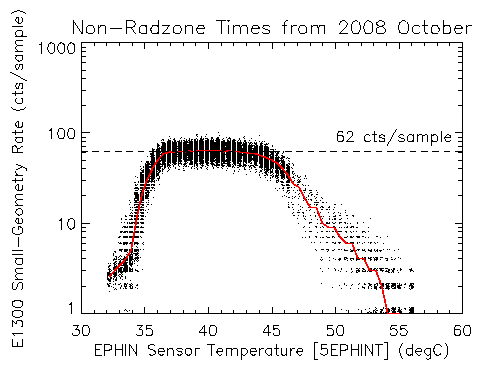
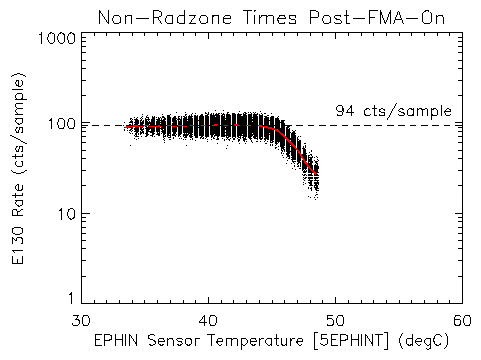
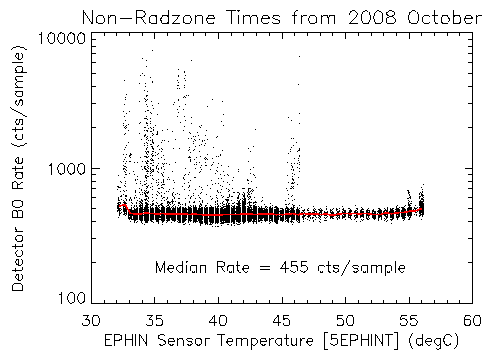
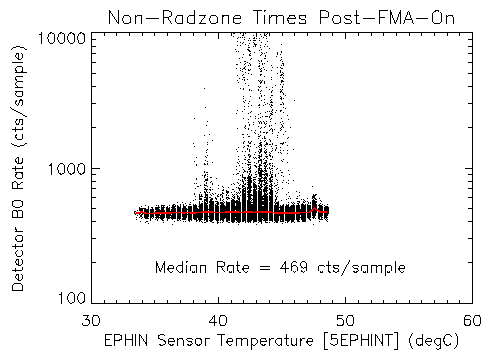
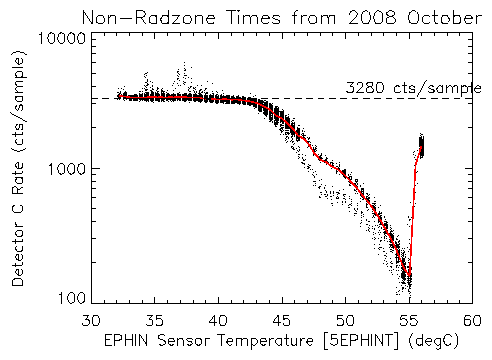
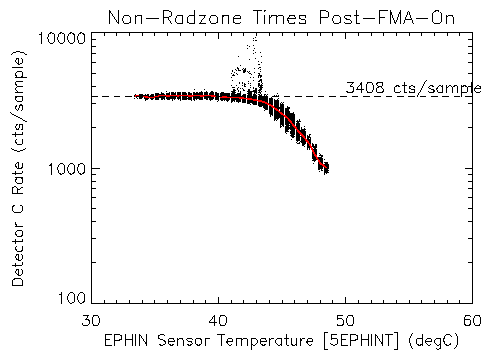
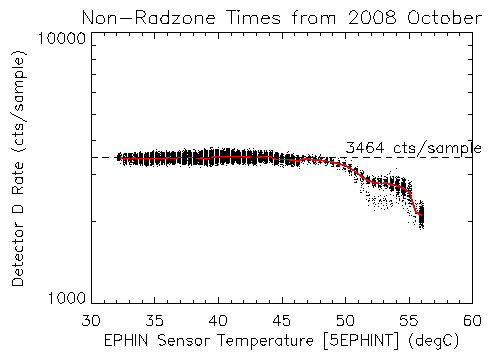
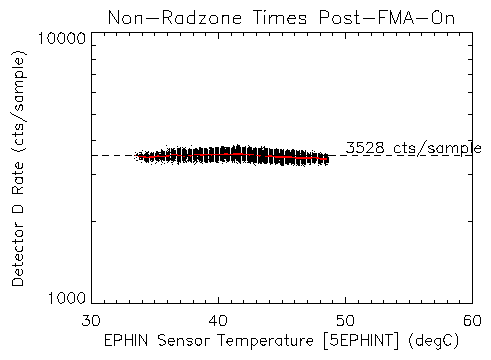
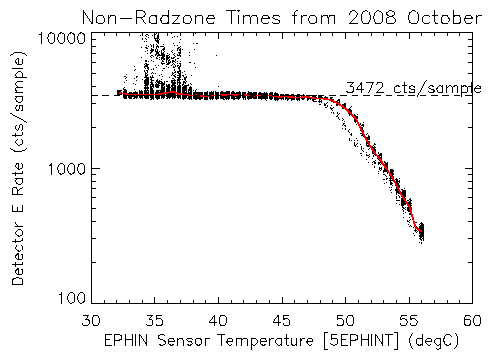
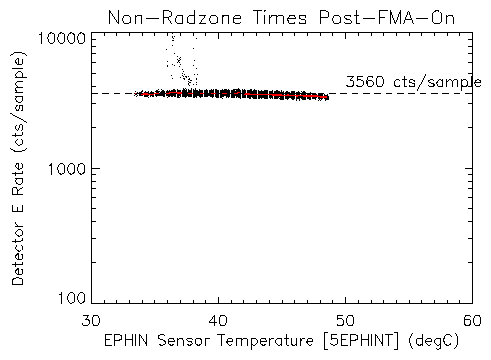
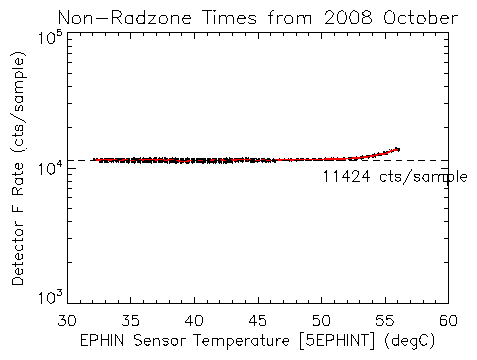
Based on input from Reinhold Mueller-Mellin of the EPHIN IPI team, we expected the "Post-" data in the electron channels to have a rate 6.88 times the "Pre-" channel small-geometry rate due to the geometry change. In addition the rate should include a contribution from protons and nuclei. The observed change in rates is much smaller, increasing by only a factor of ~1.4 in the E150 channel and ~1.5 in the E1300 channel. The individual detector rates do not show great differences between the two time intervals; so, it seems unlikely that the discrepancy between expecting a factor of 6.88 increase and seeing ~1.5 is due to environment.
| Pre- | Post- |
|---|---|
|
|
|
|
|
|
|
|
|
|
|
|
|
|
Last modified: Tue Feb 10 17:14:09 EST 2009
Dr. Michael Juda
Harvard-Smithsonian Center for Astrophysics
60 Garden Street, Mail Stop 70
Cambridge, MA 02138, USA
Ph.: (617) 495-7062
Fax: (617) 495-7356
E-mail:
mjuda@cfa.harvard.edu