EPHIN Rates v Sensor Temperature (5EPHINT) 2013-02-10 to 2013-10-05
As we continue to relax the Mission Planning Guideline that covers the
EPHIN Thermal Limit, we need to trend the EPHIN performance to
monitor for unexpected changes in performance. The plots here show
the trends observed during the period from 2013-02-10 to
2013-10-05. During this interval the TEPHIN planning limit
started at 144 degF and was raised to 147 degF on 2013-03-21 and
to 151 degF on 2013-07-11.
EPHIN data were selected for times outside the rad-zone, during the
nominally scheduled time with RadMon enabled. Data from times of
elevated solar activity have not been excluded.
The behavior of the data from the time interval covered here displays
trends expected from previous intervals:
(2011-07-17 to 2012-09-01)
and
(2012-09-01 to 2013-02-09).
Detectors D and E now show an upturn in rates at high temperatures
similar to what has previously been seen in detector C. These
increaing rates cause an upturn in the E1300 coincidence channel
rate.
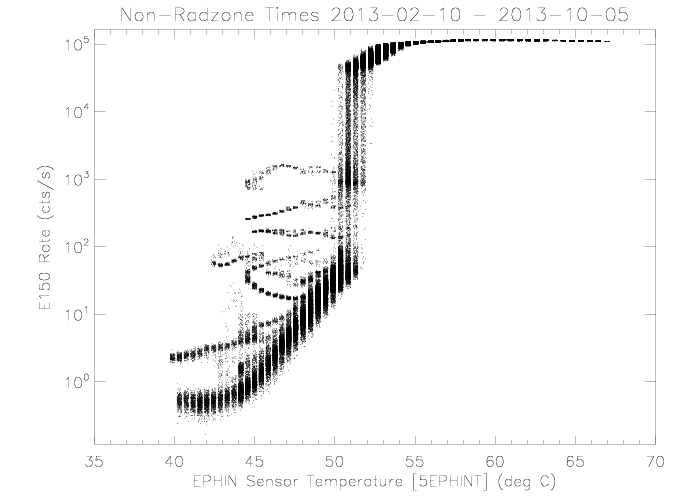
EPHIN E150 Coincidence Rate
The E150 rate shows more of the anomalous behavior first observed
during the Normal-Sun time of the CTU TLM-Processor
reset. This anomalous behavior led to halting the use of the
E150 channel for safing within RadMon.
|
| Figure 1: EPHIN E150 coincidence channel rate vs EPHIN
sensor temperature The sensor temperature values have a
small, uniformly-distributed random valued added for
display purposes.
|
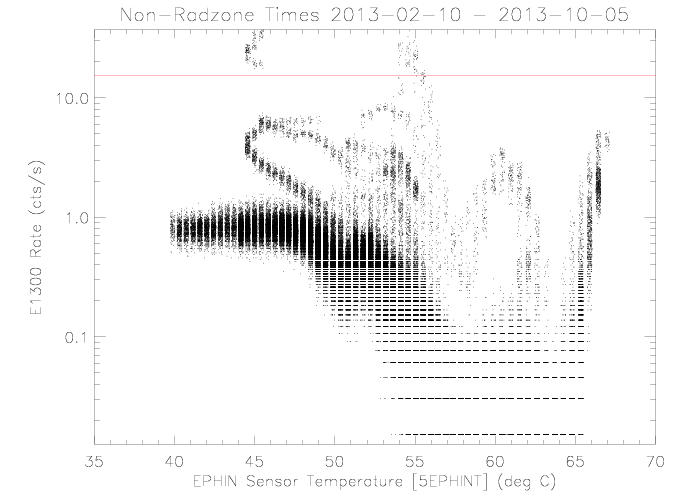
E1300 Rate
The E1300 rates show drops associated with higher EPHIN sensor
temperatures. The decrease in rate with higher temperature is due
to a decrease in detector C and D sensitivity as the temperature
increases. There is now an upturn in the E1300 rate at
temperatures greater than ~65 degC due to accidental coincidences
among the C and D detectors at their higher rates. These
accidental coincidences are approaching the RadMon trigger
threshold.
|
| Figure 2: EPHIN E1300 coincidence channel rate vs EPHIN sensor
temperature, similar to figure 1. The red hoizontal
line is drawn at the RadMon trigger threshold.
|
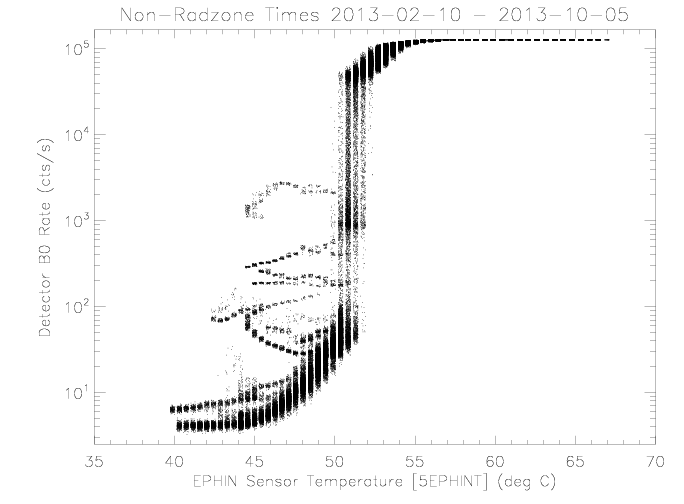
Detector B0 (Center Segment)
The detector B0 rate increases are similar to the increases in the E150 rate as expected
given that the B0 signal is the dominant component of the E150
coincidence channel. The anomalous rates in the B0 detector are
what create the anomalous E150 rates.
|
| Figure 3: EPHIN detector B0 rate vs EPHIN sensor
temperature, similar to figure 1.
|
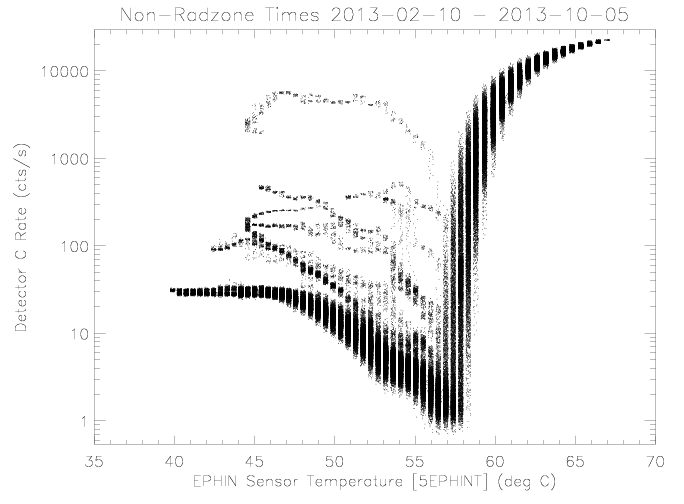
Detector C
The detector C rate decreases with increasing sensor temperature above
roughly 43 degrees C. This behavior is the same as observed prior
to setting detector A failure-mode on. The decrease in rate
implies a decreased sensitivity to particles and is due to a
lower voltage across the detector. The upturn in the rate above
55.5 degC (similar to detector B0) is likely due to leakage current.
|
| Figure 4: EPHIN detector C rate vs EPHIN sensor
temperature, similar to figure 1.
|
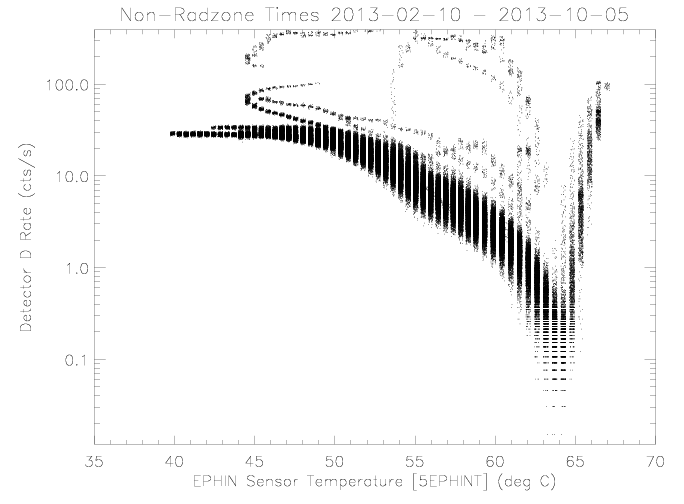
Detector D
The detector D rate decreases with increasing sensor temperature above
roughly 50 degrees C, somewhat higher than detector C. As with
detector C, the decrease in rates implies a decreased sensitivity
to particles. The higher temperature of the on-set of the decrease
is consistent with the different detector thickness. The rate
increases above 64 degrees C similar to that observed in detector
C; again the higher temperature for the onset can is due to the
greater detector thickness.
|
| Figure 4: EPHIN detector D rate vs EPHIN sensor
temperature, similar to figure 1.
|
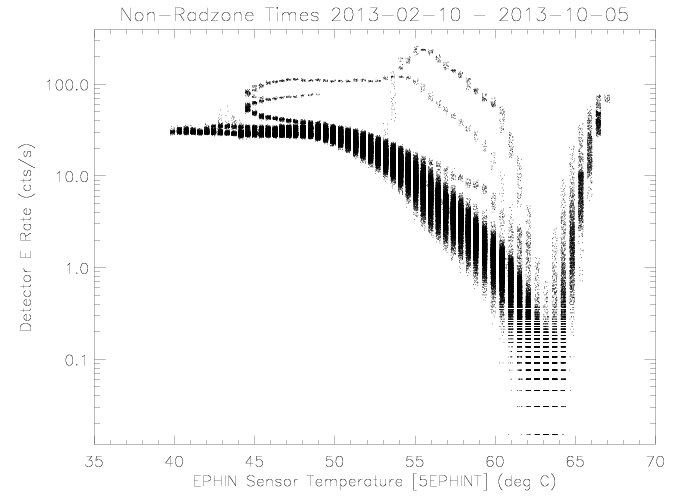
Detector E
The detector E rate decreases with increasing sensor temperature above
roughly 50 degrees C and shows a sharp increas above 64 degress C,
similar to detector D.
|
| Figure 4: EPHIN detector E rate vs EPHIN sensor
temperature, similar to figure 1.
|
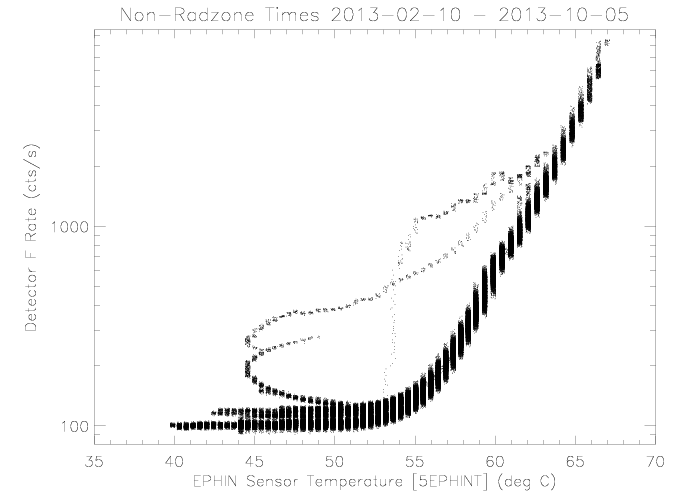
Detector F
The detector F rate shows an increase as the rate exceeds roughly 53
degrees C. This may be due to increasing noise that would be
reflected in a higher leakage current. Unfortunately, the ceiling on the
telemetry reading for the leakage current has been reached at 48
degrees C.
|
| Figure 4: EPHIN detector F rate vs EPHIN sensor
temperature, similar to figure 1.
|
Mike Juda
Last modified: Tue Oct 8 09:17:28 EDT 2013