

CALDB 3.2.1: HRMA Effective Area
For instructions on how to continue using the v6 file, read the "How can I tell CIAO to use a different HRMA effective area file?" FAQ.
It has been noted that a statistically significant residual exists in fitting certain broad band continuum sources (e.g. blazars) that is due to the depth of the iridium M-edges in the HRMA effective area relative to what these instrumental spectra exhibit at 2.1 keV. Until now, no contamination layer has been included in the HRMA model, though it has long been suspected that there must be some non-zero level of hydrocarbon accumulation on the mirror elements, given their history. It has been found that a 22A overlayer of 1g/cm^3 hydrocarbon will minimize the Ir M-edge residuals for a group of these continuum, not heavily piled-up sources.
The new HRMA effective area file, released in CALDB 3.2.1 (15 December 2005), will affect all Chandra configurations except for those with HRC-S, wherein the HRMA effective area upgrade has been counterbalanced by the new HRC-S QE, so as to produce no net change in the LETGS effective areas.
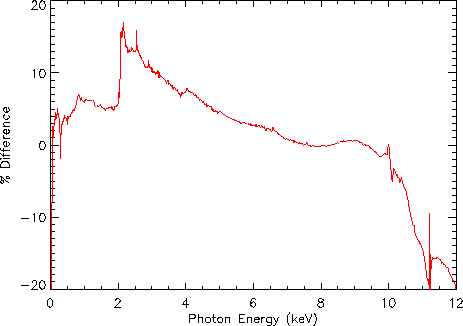
This plot shows the percent difference between the current (N0006) and new (N0007) HRMA files:
Users working in the 1-6 keV range will see a 5-10% change in spectral fitting that uses an ARF file created with the new HRMA effective area, as the following example illustrates.
Example Analysis
This example uses OBSID 1551 (G21.5-0.9 on ACIS-I3) to show the effect that the new EA will have on ACIS imaging spectral.
A spectrum was extracted from the source region of OBSID using the CIAO tool specextract. Two similar background regions bracketing the source were selected for background subtraction, and the extraction was done in PI space. Two different ARFs were built for this purpose, one with the N0006 HRMA (black traces), and the other with the N0007 HRMA (red traces), as shown in these plots:
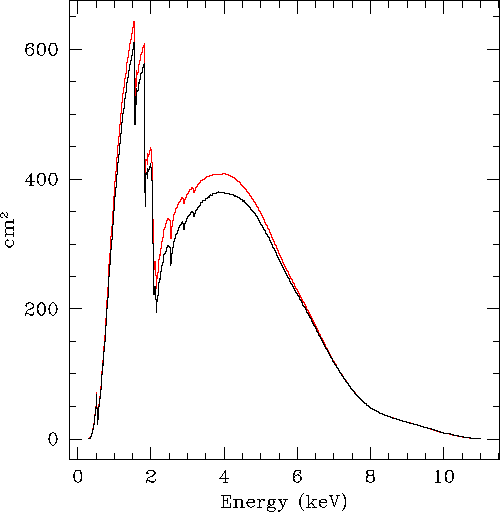
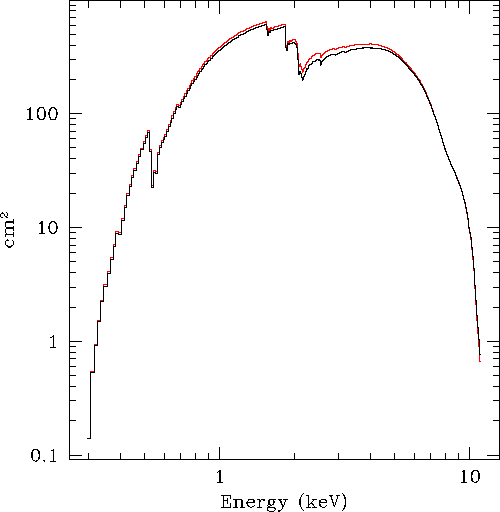
Each of the spectra was fit in Sherpa with a single powerlaw model (powlaw1d) and photoabsorption (xsphabs). This figure shows a plot of both fits and the residuals over the energy range 1.0-8.0 keV .
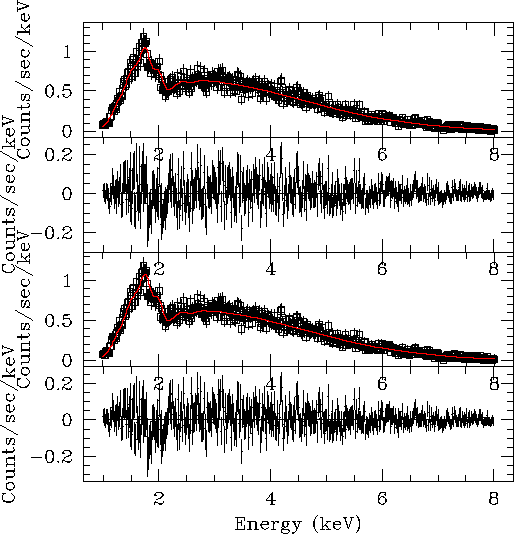
The following table gives a summary of the variations between the two ARFs in the model for several energy ranges:
| Energy Range (keV) |
Energy Flux: (HRMA N0006) (ergs/cm^2/s) |
Energy Flux: (HRMA N0007) (ergs/cm^2/s) |
% Change |
|---|---|---|---|
| 1.0-2.0 | 3.22525e-12 | 2.99582e-12 | -7.7 |
| 2.1-3.0 | 7.49983e-12 | 6.7982e-12 | -10.3 |
| 3.0-6.0 | 2.36455e-11 | 2.21574e-11 | -6.7 |
| 6.0-8.0 | 1.17781e-11 | 1.15531e-11 | -1.9 |
| 1.0-8.0 | 6.0771e-11 | 5.82566e-11 | -4.3 |
Note that the greatest change in energy flux (-10.3%) occurs in the 2.1-3.0 keV range, which contains the M-edge. This where the HRMA EA increase is greatest (10-16%).
Depending on your source spectrum, there may be some significant change to the derived energy (and photon) flux from your source, at the levels indicated in the "% Change" column above. For those working with line sources, particularly in the 2-3 keV range, the effect will also be significant.
For further technical details on the HRMA effective area file, refer to the Improving the Relative Accuracy of the HETGS Effective Area memo (23 pp, PDF).