 |
 |
 |
|
Image 11 of 13 |
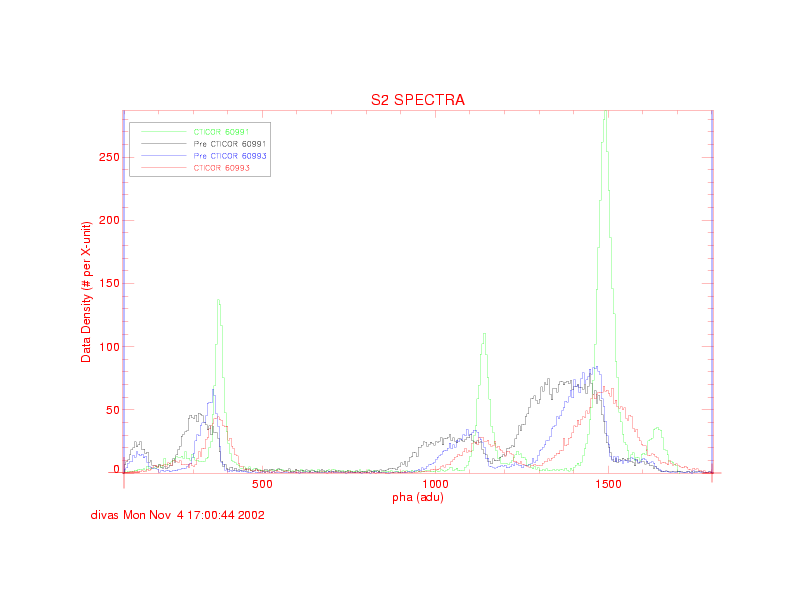
Now we blindly apply Leisa Townsley's CTI corrector to this data (using the values of CHIPY in the event list), do the standard filtering etc. and plot the spectra in PHA space again along with the pre-CTI correction spectra.
In the TE mode data (where we know the CHIPY positions for the events) the CTI corrector does a fantastic job. It takes the raw TE data (black line) and gives the corrected spectrum (green line) which is what would be expected.
In the CC mode data -- since we do not know the CHIPY and use essentially a random number -- we start from the raw CC spectrum (blue line) and the CTI corrector gives he corrected (red line). The CTI corrector recovers the mean energy for the lines quite accurately (as compared to the CTI corrected TE data), but the lines are very broad.