 |
 |
 |
|
Image 1 of 13 |
The four lines we used are 1.48 keV. 4.51 keV, 5.89 keV and 6.49 keV. For each line we fit a "Gaussian" and a "Gaussian + constant". There is no significant difference between the two fits. The mean and the sigma of the Gaussian are used for various comparisons.
The following table shows all the Cal data analyzed and their basic properties. One of the concern was that the FP temperature was changing in the initial CC mode Ext Cal Source observations and that could affect the results.
| obsid | targetname | ksec | ccd | mode | temp | btmp |
| 61007 | Faint_Mode_S | 7.8 | S6 | Te3x3 | -119.7 | -120 |
| 61006 | Faint_Mode_I | 8.5 | I6 | Te3x3 | -119.7 | -119.8 |
| 61005 | CC_Bias_03 | 8.9 | S6 | CC3x3 | -119.7 | -119.8 |
| 61004 | Faint_Mode_I | 8.5 | I6 | Te3x3 | -119.7 | -119.8 |
| 61002 | Faint_Mode_I | 7.8 | I6 | Te3x3 | -119.6 | -119.7 |
| 61001 | Faint_Mode_S | 8.5 | S6 | Te3x3 | -119.7 | -119.7 |
| 60993 | CC_Bias_04 | 8.9 | S6 | CC3x3 | -119.8 | -119.8 |
| 60991 | Faint_Mode_I | 8.5 | I6 | Te3x3 | -119.7 | -120 |
| 61152 | Faint_Mode_S | 7.8 | S6 | Te3x3 | -119.7 | -119.8 |
| 61151 | Faint_Mode_I | 8.5 | I6 | Te3x3 | -119.7 | -119.5 |
| 61149 | Faint_Mode_I | 7.8 | I6 | Te3x3 | -119.7 | -119.7 |
| 61148 | CC_Bias_01 | 9.6 | S6 | CC3x3 | -118 | -116.9 |
| 61145 | Faint_Mode_S | 7.8 | S6 | Te3x3 | -119.8 | -119.8 |
| 61143 | CC_Bias_02 | 9.5 | S6 | CC3x3 | -118.8 | -117.6 |
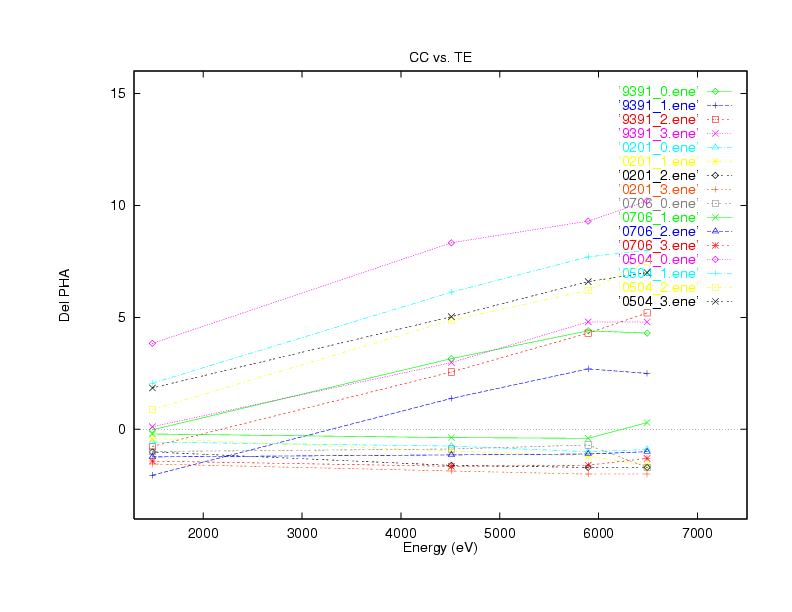
The difference between the PHA values for the four lines and those for a reference TE mode observation are plotted as a function of energy. The horizontal lines near "zero" are TE-TE and the sloped lines are for CC-TE. The CC mode data shows larger PHA values corresponding to the 4 lines than the TE data. This can be accounted by a gain change in the CC mode.