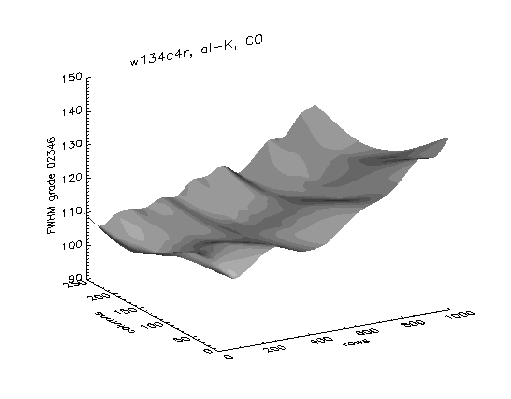
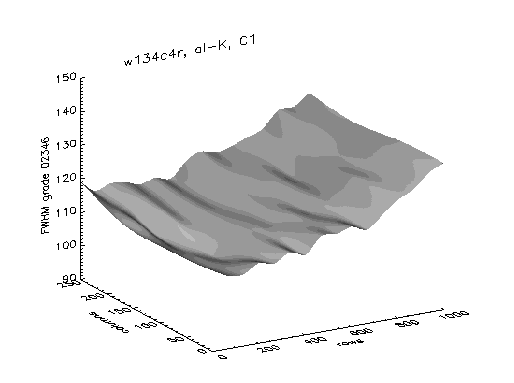
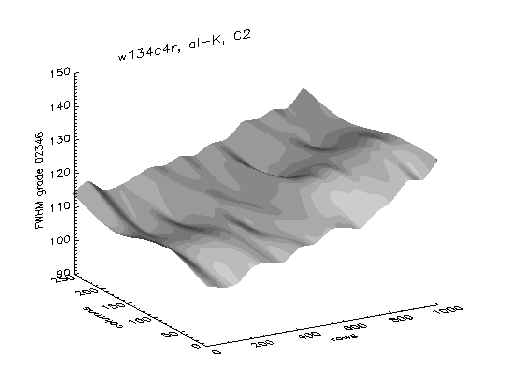
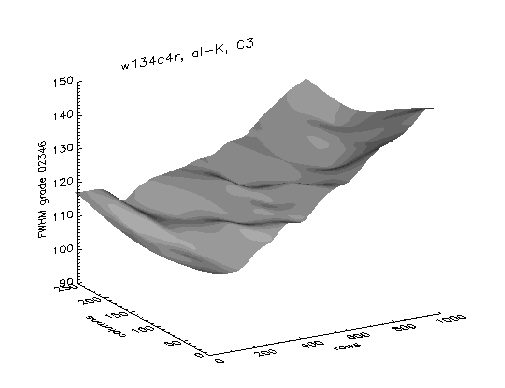
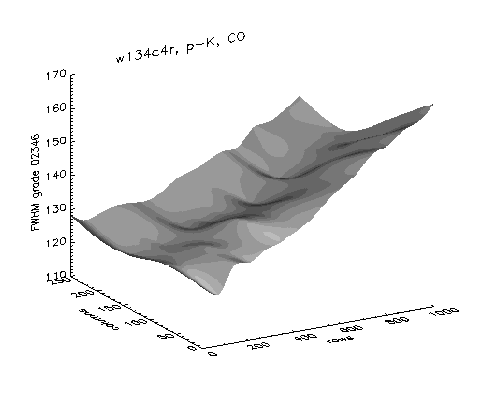
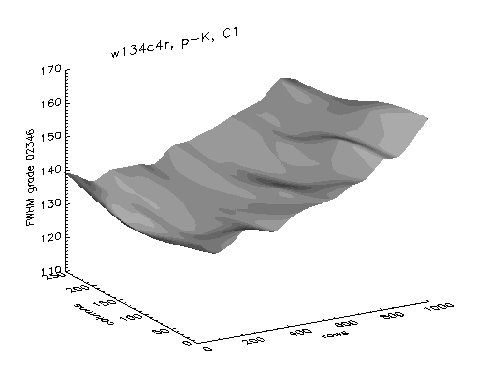
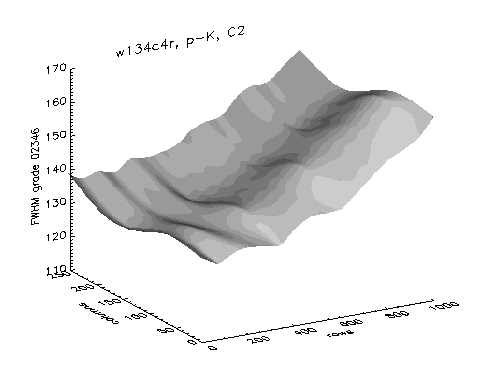
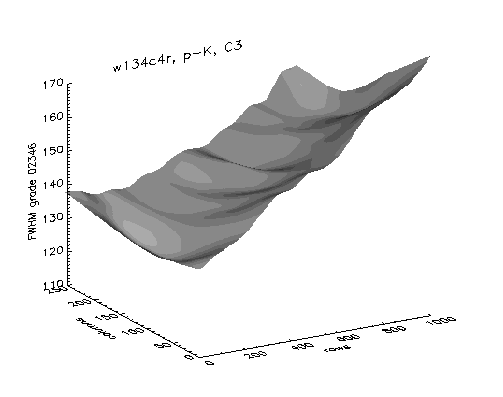
Table G: Spatial variations of FWHM and line centroids across each node of w134c4r
energy
node
3-dim figure
data
eV
1487
0
75
75
1
76
76
2
77
77
3
78
78
1740
0
79
79
1
80
80
2
81
81
3
82
82
2014
0
83
83
1
84
84
2
85
85
3
86
86